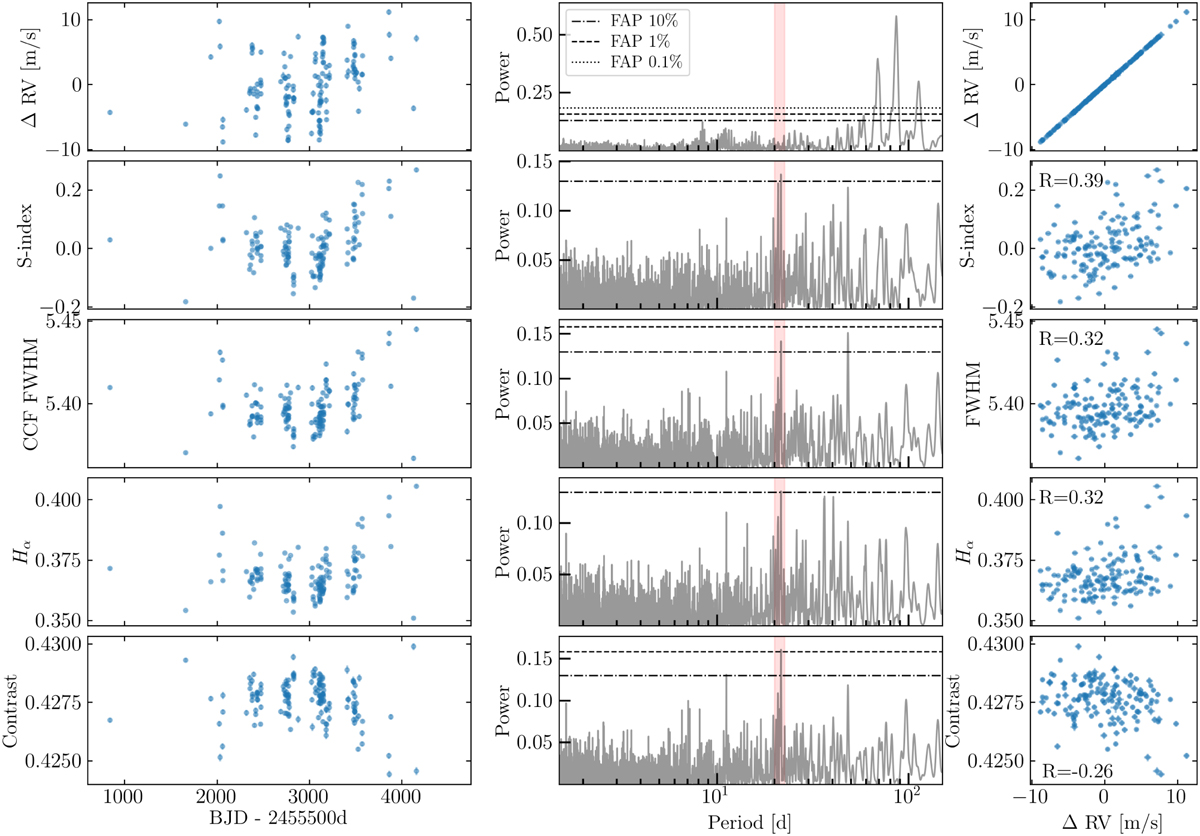
Fig. A.3
Download original image
HARPS-N YARARA-V1 RV and spectroscopic activity indicators of HD 147379. Similar description to Fig. A.2, except with the periodogram computation. The long-period trends observed in the time-series of the spectroscopic indicators are better fitted by quadratic drifts instead of Keplerians. The corresponding periodograms were computed from the residuals of these fits.
Current usage metrics show cumulative count of Article Views (full-text article views including HTML views, PDF and ePub downloads, according to the available data) and Abstracts Views on Vision4Press platform.
Data correspond to usage on the plateform after 2015. The current usage metrics is available 48-96 hours after online publication and is updated daily on week days.
Initial download of the metrics may take a while.