Fig. A.2
Download original image
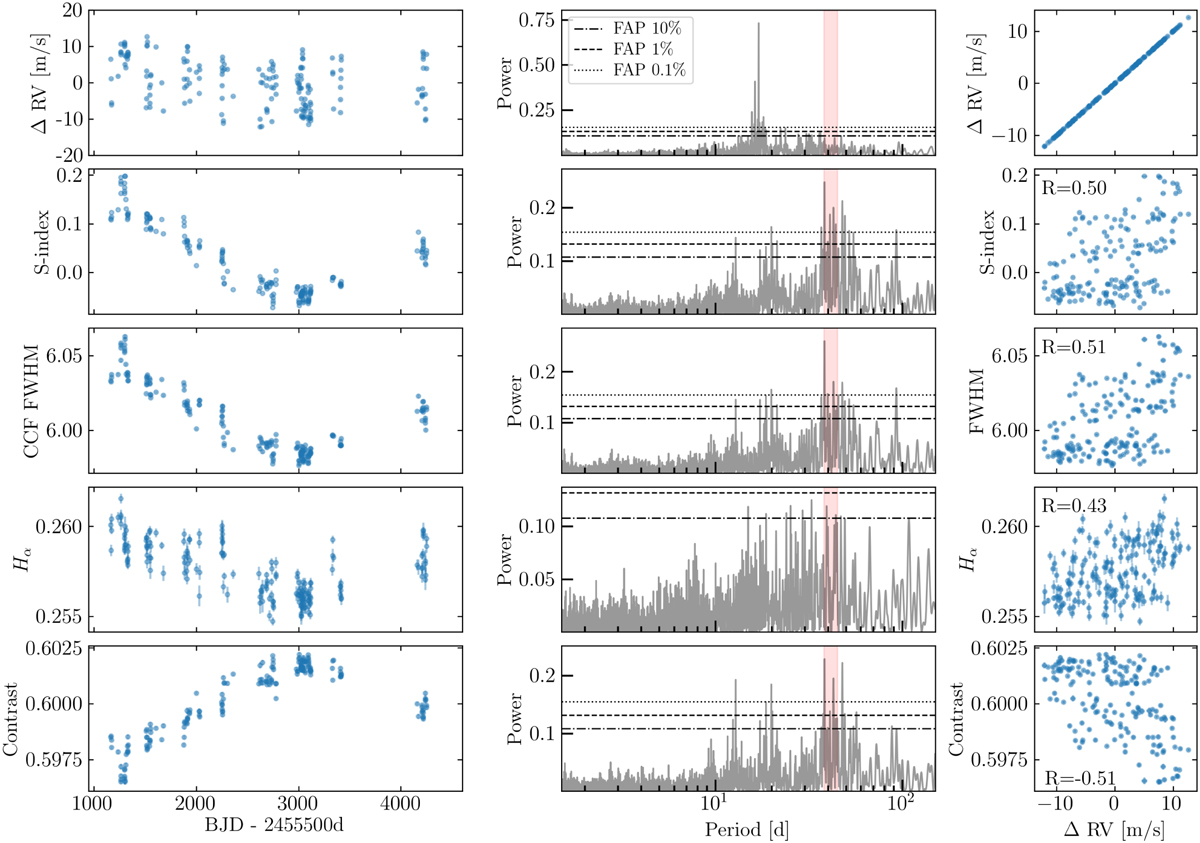
HARPS-N RV and spectroscopic activity indicators of HD 99492. This dataset is cleaned from instrumental systematics but still contains the stellar activity features, as obtained with the YARARA-V1 post-process described in Sect. 3.1 and Appendix C. The left column presents the RV and indicator time-series, while the middle column contains the periodograms of these time-series. No drift nor white noise was included prior to their computation. However concerning the activity indicators, we included a Keplerian in the model so to absorb most of the long-period power, which impacts the short-period signals. In those cases, we present the periodograms of the residuals. The red bands depict the estimated range for the stellar rotation period, obtained from both literature and a preliminary analysis of our data. The right column illustrates the correlation between the various indicators and the RV.
Current usage metrics show cumulative count of Article Views (full-text article views including HTML views, PDF and ePub downloads, according to the available data) and Abstracts Views on Vision4Press platform.
Data correspond to usage on the plateform after 2015. The current usage metrics is available 48-96 hours after online publication and is updated daily on week days.
Initial download of the metrics may take a while.