Fig. C.1
Download original image
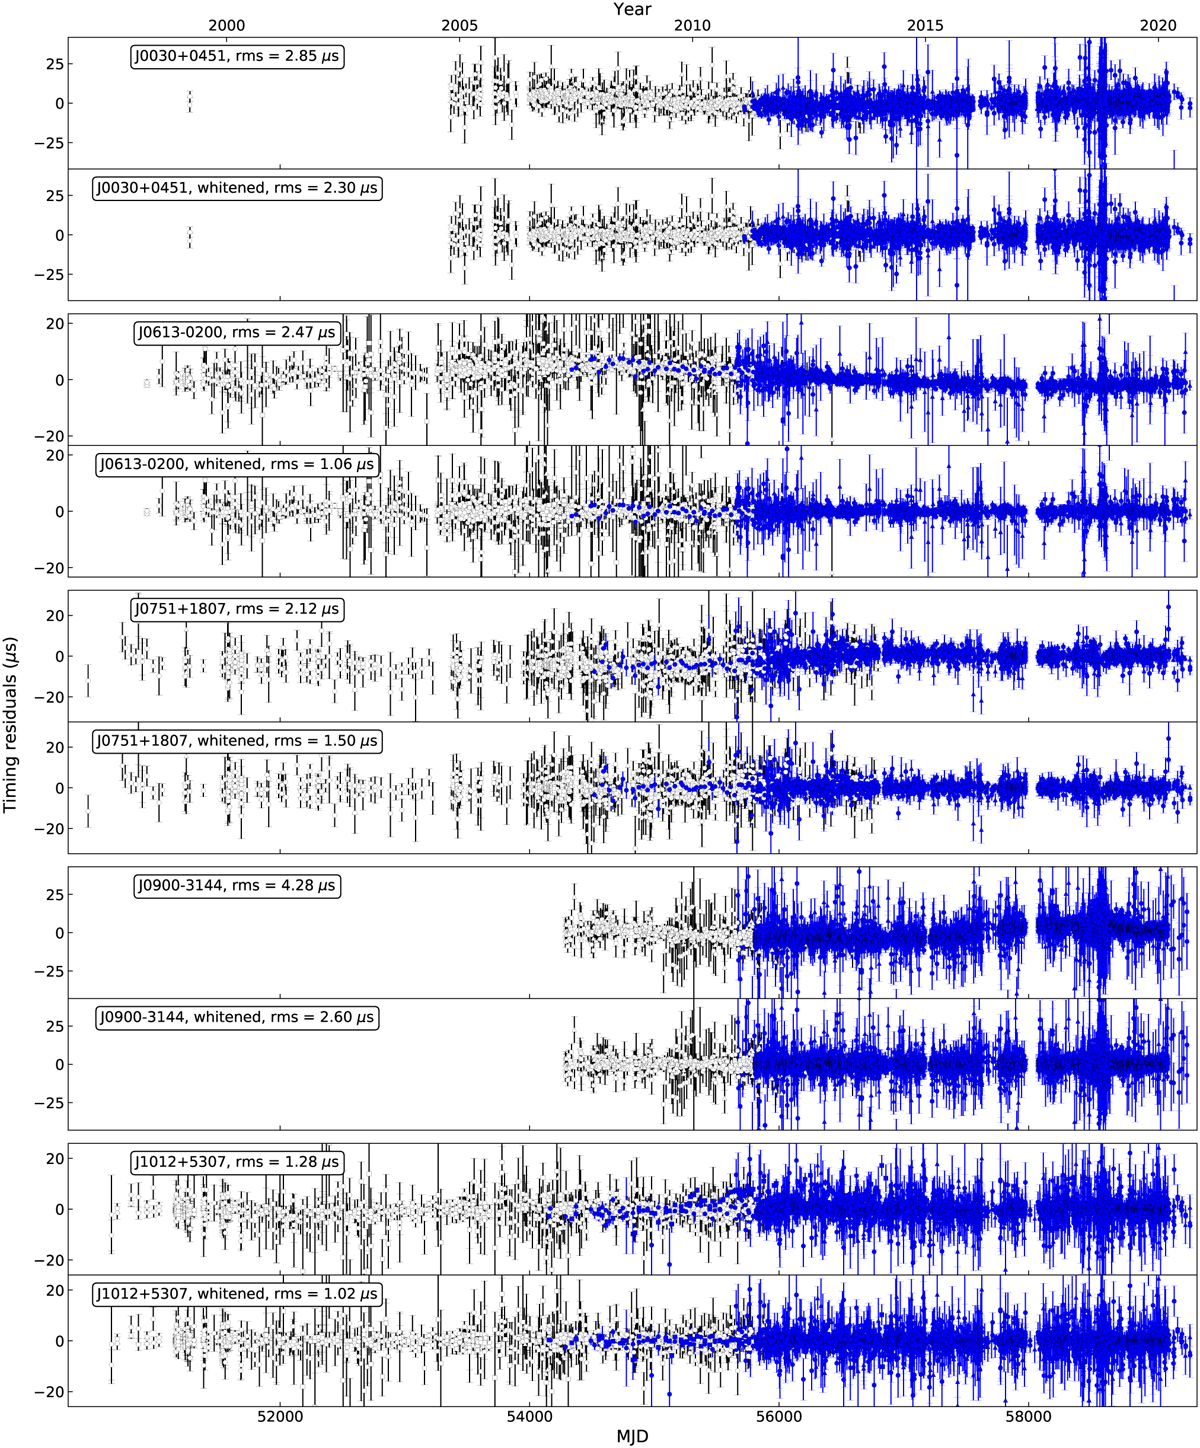
Timing residuals of PSRs J0030+0030, J0613-0200, J0751 + 1807, J0900−3144, J1012+5307. For each pulsar, the residuals before and after subtraction of DM and monochromatic red noise are shown. The squares, circles and triangles represent P-band, L-band and S/C-band observations, respectively (see Table 2 for frequency coverage of each band). The blue/filled and black/unfilled symbols indicate the new backend data and those from EPTA DR1, respectively.
Current usage metrics show cumulative count of Article Views (full-text article views including HTML views, PDF and ePub downloads, according to the available data) and Abstracts Views on Vision4Press platform.
Data correspond to usage on the plateform after 2015. The current usage metrics is available 48-96 hours after online publication and is updated daily on week days.
Initial download of the metrics may take a while.