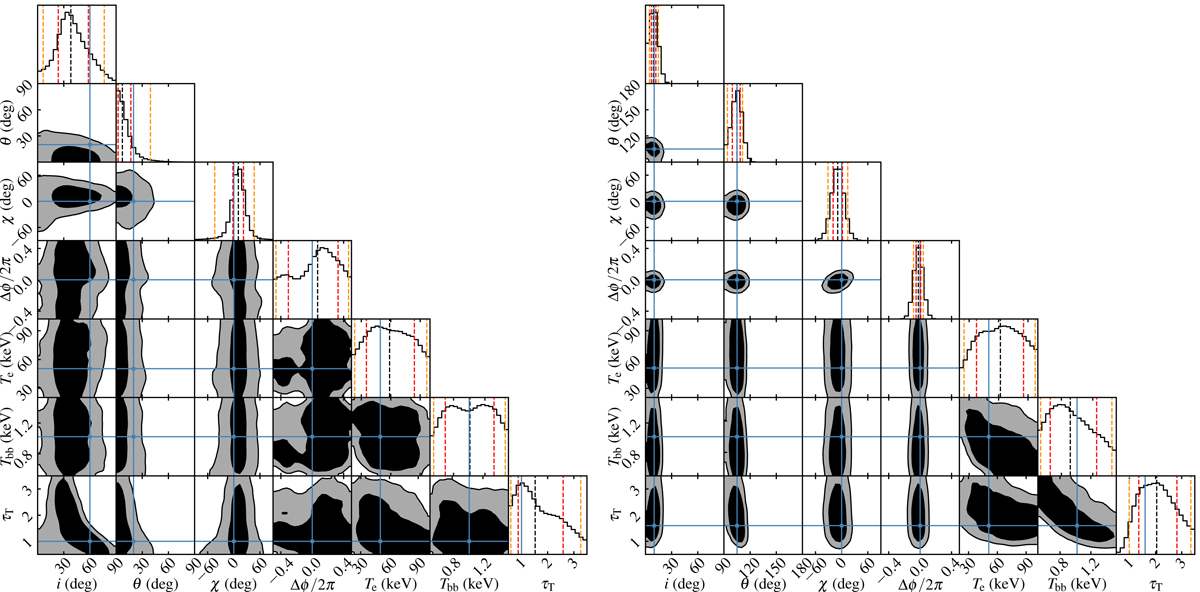
Fig. 6.
Download original image
Posterior probability distributions for NS parameters for Model 1a (left panels) and Model 4 (right panels) from Table 1 using one data realization. The two-dimensional contours correspond to 68% and 95% credible regions with the corresponding regions colored black and gray. The histograms show the normalized one-dimensional distribution for a given parameter derived from the posterior samples. The mean value and the 68% and 95% credible levels for the parameters are shown by the vertical dashed black, red, and orange lines, respectively. Blue lines indicate the true values of the parameters that were used for the data simulations.
Current usage metrics show cumulative count of Article Views (full-text article views including HTML views, PDF and ePub downloads, according to the available data) and Abstracts Views on Vision4Press platform.
Data correspond to usage on the plateform after 2015. The current usage metrics is available 48-96 hours after online publication and is updated daily on week days.
Initial download of the metrics may take a while.