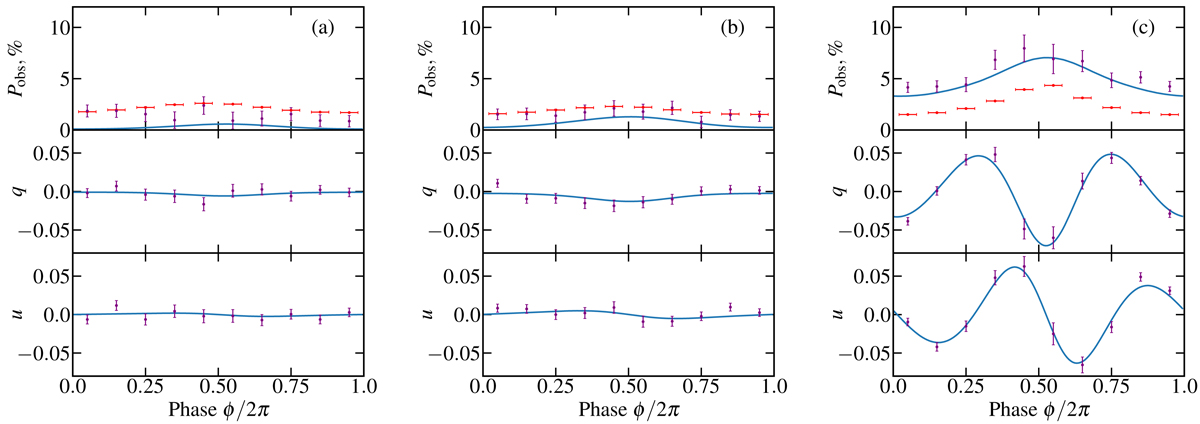
Fig. 5.
Download original image
Simulated PD and normalized Stokes q and u profiles for the NS parameter set 1 (panels a and b are for the 2–8 keV and 2–5 keV energy range, respectively) and set 4 (panel c) from Table 1. The exposure time is 600 ks in all three cases. The blue lines show the theoretical model, the purple dots are the synthesized observed data, and the red dots are the MDP values for the corresponding phase bins.
Current usage metrics show cumulative count of Article Views (full-text article views including HTML views, PDF and ePub downloads, according to the available data) and Abstracts Views on Vision4Press platform.
Data correspond to usage on the plateform after 2015. The current usage metrics is available 48-96 hours after online publication and is updated daily on week days.
Initial download of the metrics may take a while.