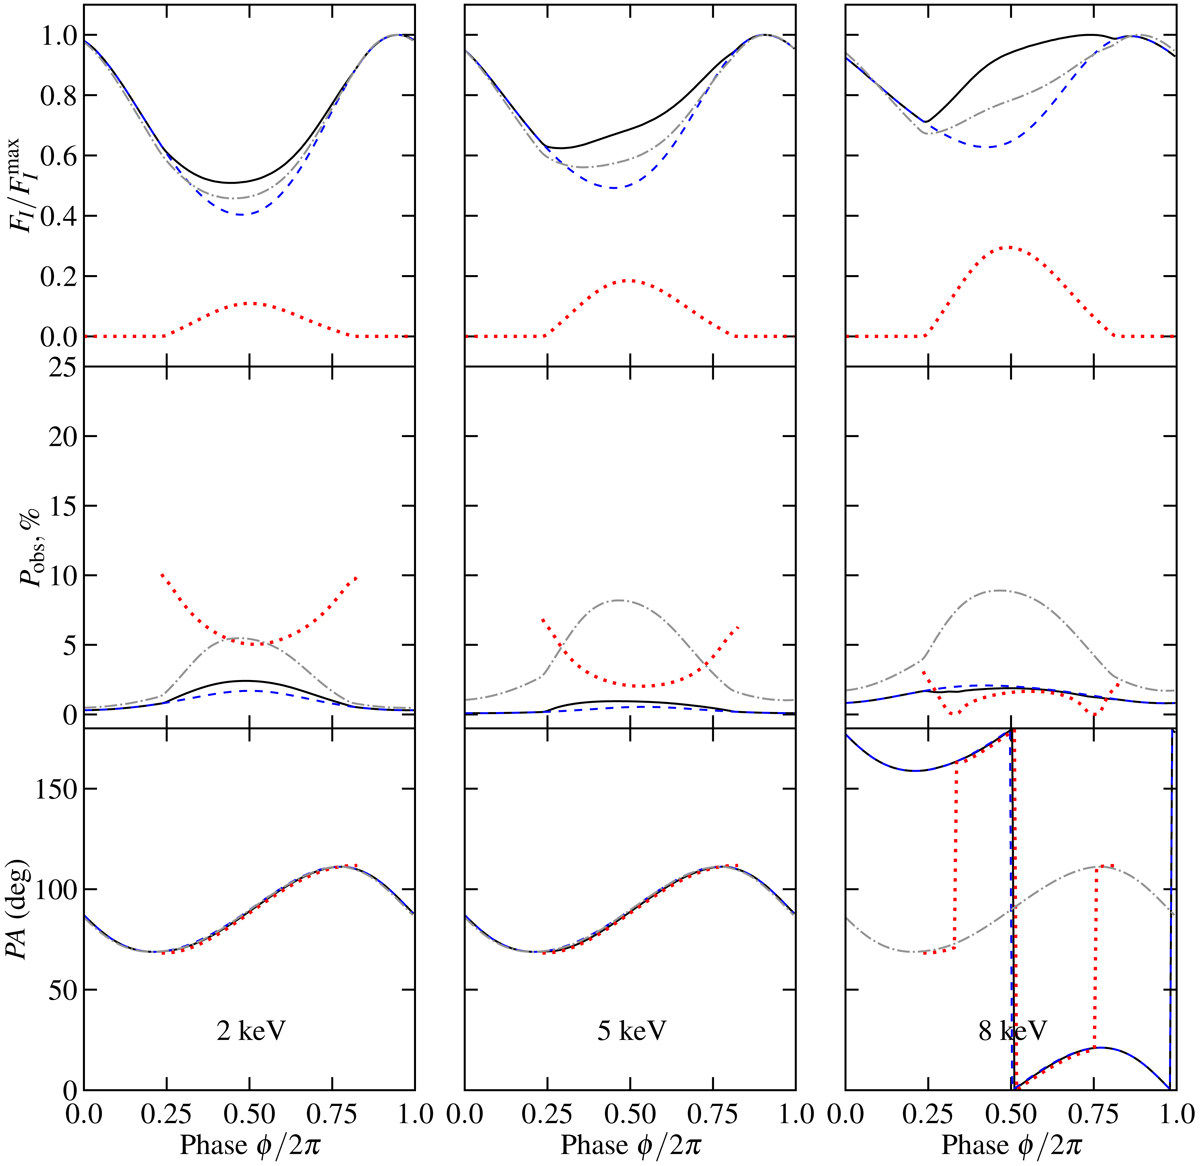
Fig. 4.
Download original image
Pulse profiles of the observed flux, PD, and PA for two antipodal spots shown for three different energies (2, 5, 8 keV). The solid black curves correspond to the total flux (PD, PA), the dashed blue lines correspond to the contribution from the primary spot, and the dotted red lines are for the secondary spot. The dash-dotted gray lines correspond to the Thomson model from Salmi et al. (2021; combined from two spots). The NS parameters in both models are those shown in Table 1 of Salmi et al. (2021).
Current usage metrics show cumulative count of Article Views (full-text article views including HTML views, PDF and ePub downloads, according to the available data) and Abstracts Views on Vision4Press platform.
Data correspond to usage on the plateform after 2015. The current usage metrics is available 48-96 hours after online publication and is updated daily on week days.
Initial download of the metrics may take a while.