Fig. 5.
Download original image
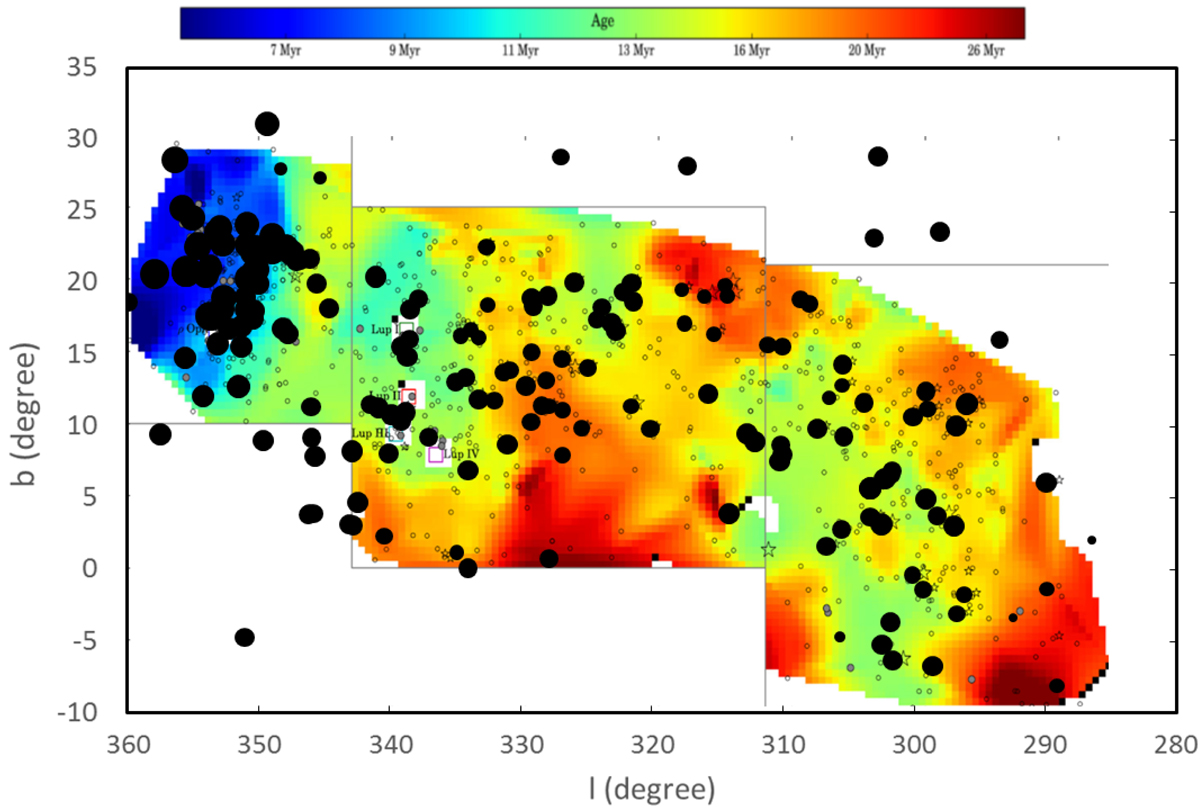
Map of the ages assumed for the programme stars and the age map by Pecaut & Mamajek (2016; coloured map in transparency; redder colours are oldest stars, blue are younger; the colour scale is above the plot). The area of the black blobs is inversely proportional to the age in our analysis. The smallest value is for HIP 54767 (84.5 Myr); this star is not actually member of Sco-Cen.
Current usage metrics show cumulative count of Article Views (full-text article views including HTML views, PDF and ePub downloads, according to the available data) and Abstracts Views on Vision4Press platform.
Data correspond to usage on the plateform after 2015. The current usage metrics is available 48-96 hours after online publication and is updated daily on week days.
Initial download of the metrics may take a while.