Fig. 1
Download original image
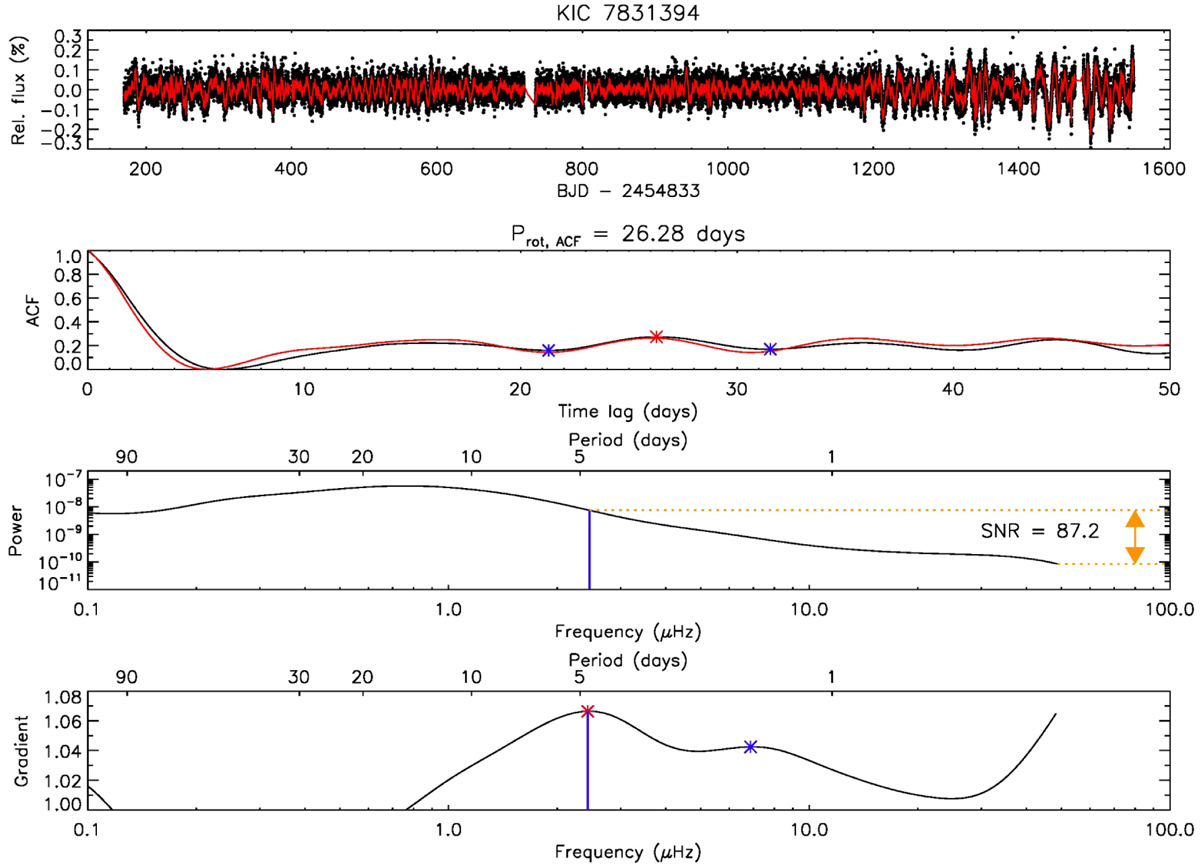
Example of a variable Kepler star and different period analysis methods applied to the data. Top panel: original (black dots) and 3 h-binned (red line) light curve of the star KIC 7831394. Second panel: global (black) and local (red) auto-correlation functions (ACFs). The best ACF period is found at 26.28 days. Third panel: global wavelet power spectrum (black). The vertical blue line indicates the position of the inflection point. The ratio between the power at the inflection point and the minimum is defined as signal-to-noise ratio (S/N), indicated by the orange arrow between the dotted lines. Bottom panel: gradient of the power spectrum (GPS). The maximum is found at the inflection period PIP = 4.76 days, marked by the blue line and the red asterisk.
Current usage metrics show cumulative count of Article Views (full-text article views including HTML views, PDF and ePub downloads, according to the available data) and Abstracts Views on Vision4Press platform.
Data correspond to usage on the plateform after 2015. The current usage metrics is available 48-96 hours after online publication and is updated daily on week days.
Initial download of the metrics may take a while.