Fig. 5.
Download original image
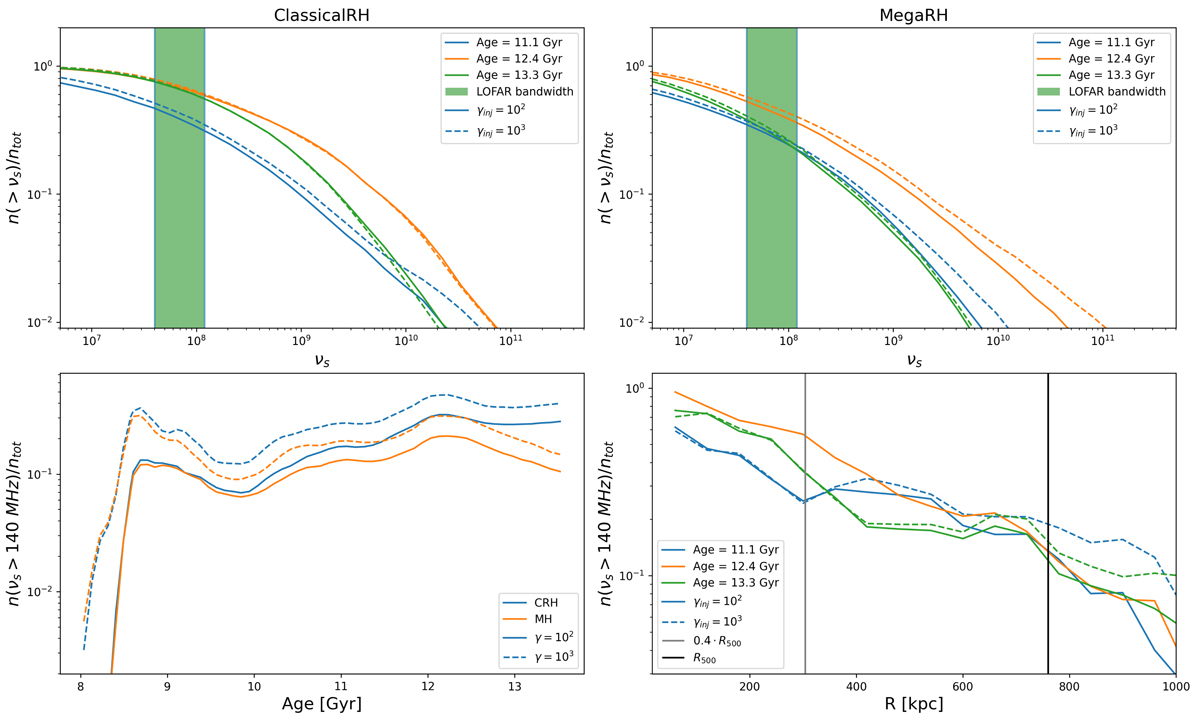
Fraction of visible electrons with respect the frequency, the time and the distance from the center of the cluster. Top panels: Distribution of emission frequencies for the classicalRHs and megaRHs for three epochs (11.1, 12.4, and 13.3 Gyr) and γinj = 102 or = 103. The vertical green areas show the frequency range covered by LOFAR LBA and HBA. Bottom left panel: Evolution of the fraction of tracers whose predicted emission frequency νc is larger than the central LOFAR HBA frequency, for the same models. Bottom right panel: Radial profile of the fraction of tracers whose emission frequency νc is larger than the central LOFAR HBA frequency, for the same epochs as those shown above.
Current usage metrics show cumulative count of Article Views (full-text article views including HTML views, PDF and ePub downloads, according to the available data) and Abstracts Views on Vision4Press platform.
Data correspond to usage on the plateform after 2015. The current usage metrics is available 48-96 hours after online publication and is updated daily on week days.
Initial download of the metrics may take a while.