Fig. 1.
Download original image
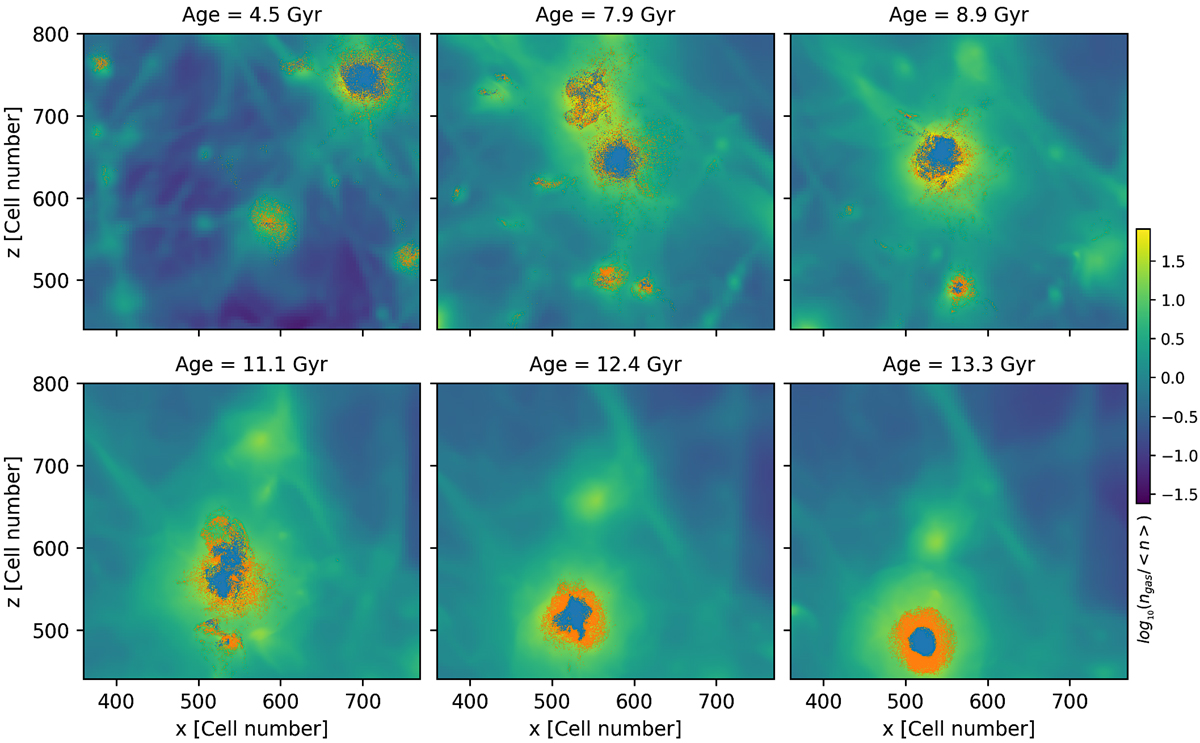
Colour map showing the evolution of the projected comoving gas density (normalised to the total mean matter density) averaged along the full line of sight of the simulation for six different epochs. The points show the projected distribution of the tracers used in our analysis, which are colour coded in orange (for tracers ending up in the megaRH region) or blue (for tracers ending up in the classicalRH region).
Current usage metrics show cumulative count of Article Views (full-text article views including HTML views, PDF and ePub downloads, according to the available data) and Abstracts Views on Vision4Press platform.
Data correspond to usage on the plateform after 2015. The current usage metrics is available 48-96 hours after online publication and is updated daily on week days.
Initial download of the metrics may take a while.