Fig. 8.
Download original image
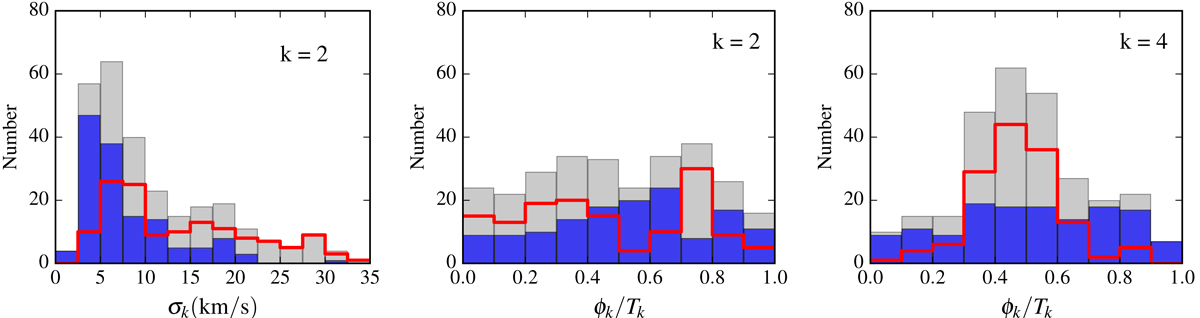
Histograms of the velocity dispersion amplitudes σk (k = 2, left panel) and of the normalised phase angles ϕk/Tk (k = 2, middle panel and 4, right panel) for the 7 galaxies brighter and fainter than M = −20.7 mag (red and blue colours, respectively) for the THINGS sample. The sub-samples are the same as when splitting between high (red) and low (blue) projected maximum velocity (see Sect. 5.2.4). The grey histograms are the total distributions from Fig. 5.
Current usage metrics show cumulative count of Article Views (full-text article views including HTML views, PDF and ePub downloads, according to the available data) and Abstracts Views on Vision4Press platform.
Data correspond to usage on the plateform after 2015. The current usage metrics is available 48-96 hours after online publication and is updated daily on week days.
Initial download of the metrics may take a while.