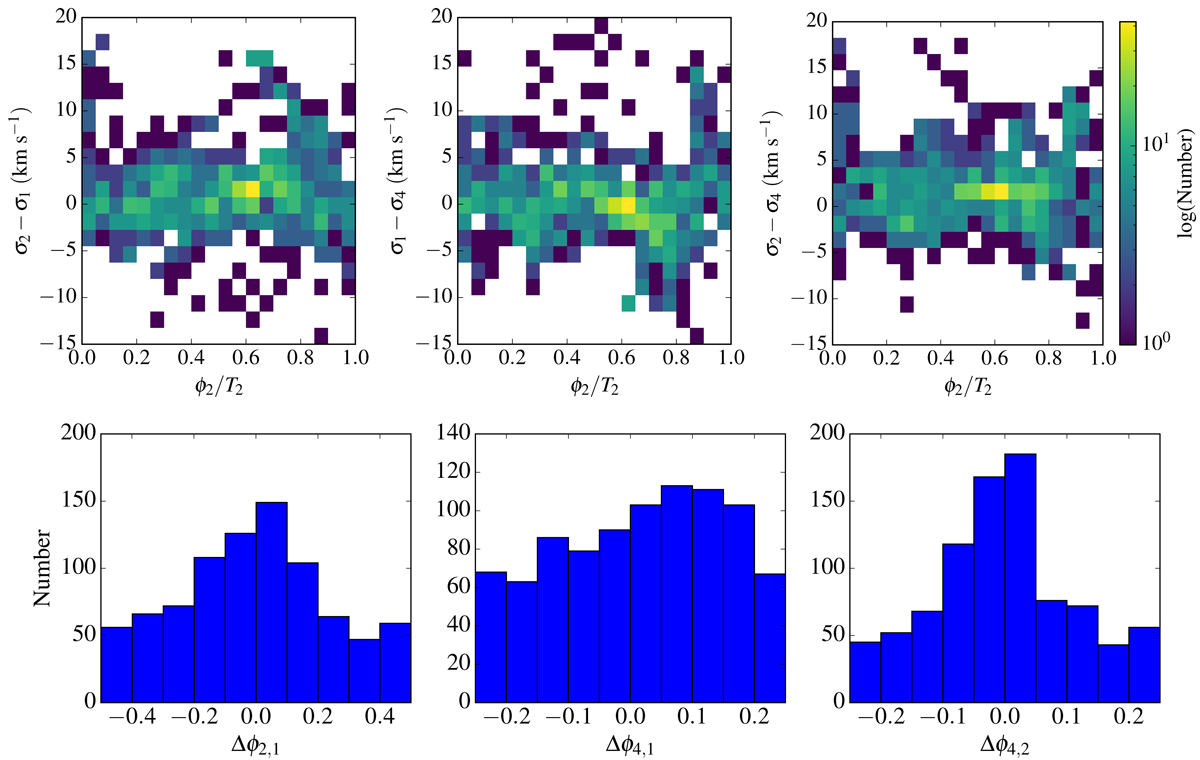
Fig. 6.
Download original image
Comparisons of amplitudes and phase angles between the Fourier k = 1, 2 and 4 orders, shown as differences of amplitudes versus ϕ2/T2 (upper row) and histograms of phase angles difference normalised to π (bottom row). The comparisons between the orders k = 1 and k = 2, k = 1 and k = 4, and k = 2 and k = 4 are shown in the left, middle, and right columns, respectively. In the upper row, the amplitude difference is colour coded with the logarithmic number of the tilted rings.
Current usage metrics show cumulative count of Article Views (full-text article views including HTML views, PDF and ePub downloads, according to the available data) and Abstracts Views on Vision4Press platform.
Data correspond to usage on the plateform after 2015. The current usage metrics is available 48-96 hours after online publication and is updated daily on week days.
Initial download of the metrics may take a while.