Fig. D.1.
Download original image
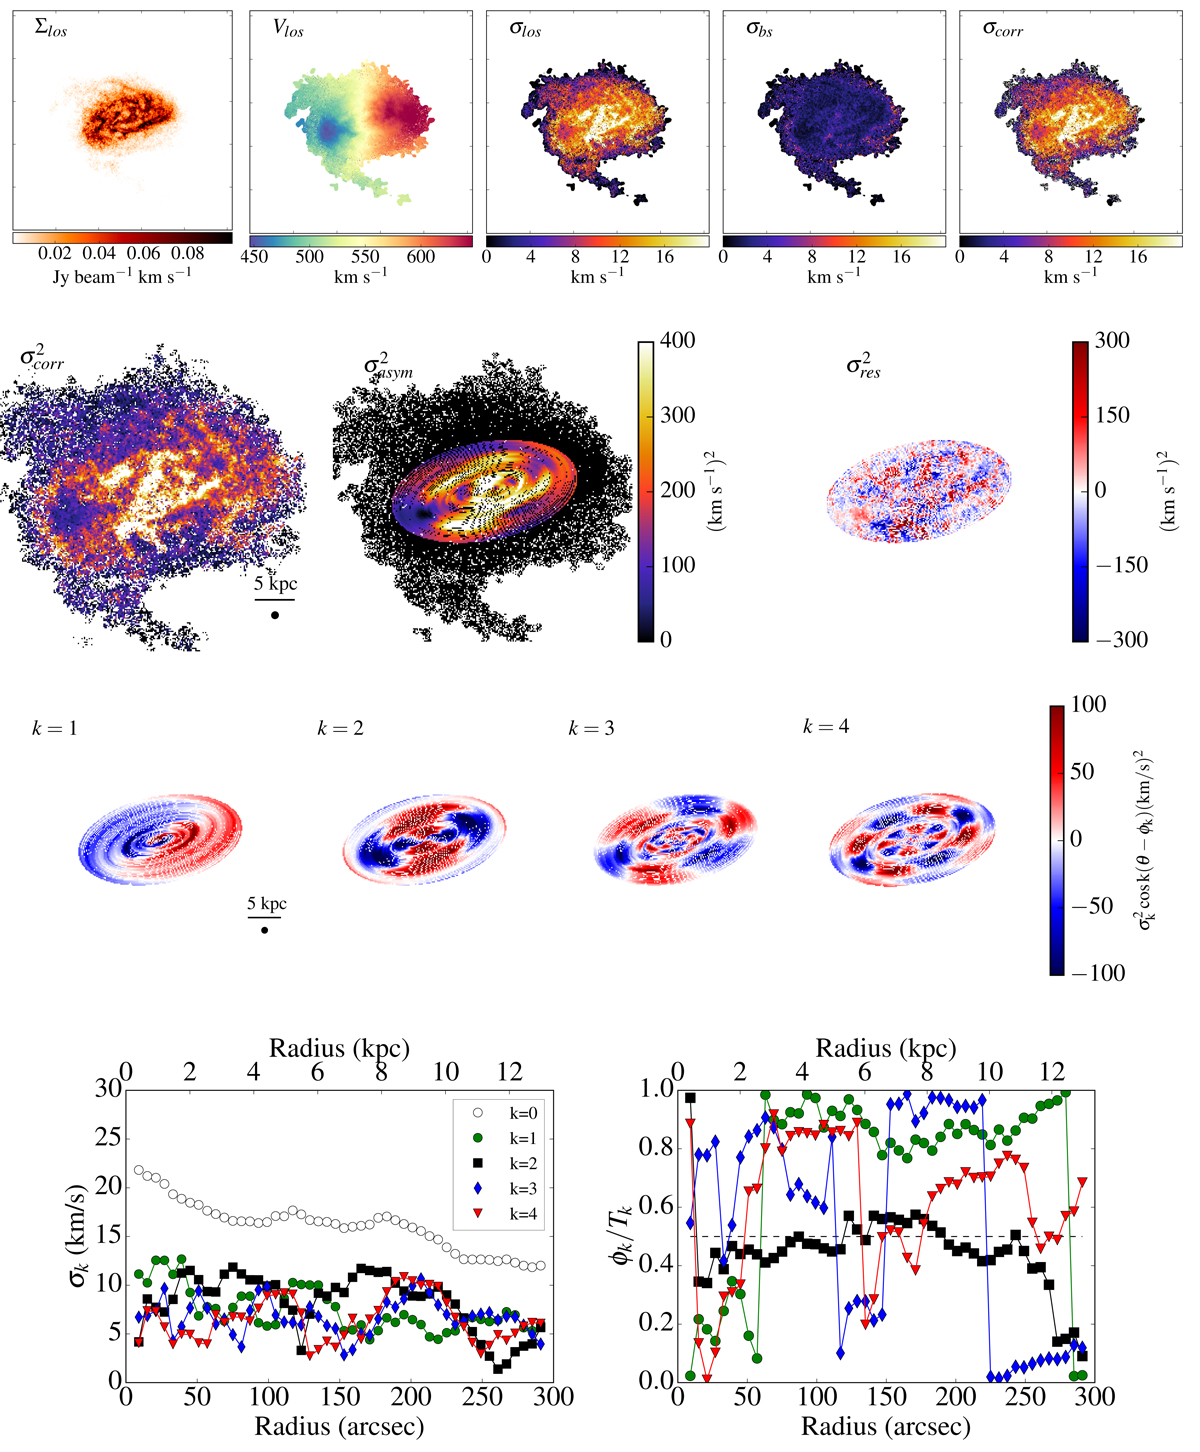
H I density and velocity maps and FFT results of NGC925. (Top panel, from left to right) Observed flux density map, observed velocity field, observed velocity dispersion, beam smearing model, and velocity dispersion map corrected from the beam smearing effect. (Second panel, from left to right) Squared observed velocity dispersion and its corresponding modelling through FFT up to the order 4, and the residuals between those two maps. (Third panel) Individual squared orders of the FFT modelling projected in the plane of the galaxy. (Bottom panel) Radial variation of the FFT amplitudes (left) and phase angles (right) for orders k = 0 to k = 4.
Current usage metrics show cumulative count of Article Views (full-text article views including HTML views, PDF and ePub downloads, according to the available data) and Abstracts Views on Vision4Press platform.
Data correspond to usage on the plateform after 2015. The current usage metrics is available 48-96 hours after online publication and is updated daily on week days.
Initial download of the metrics may take a while.