Fig. 10.
Download original image
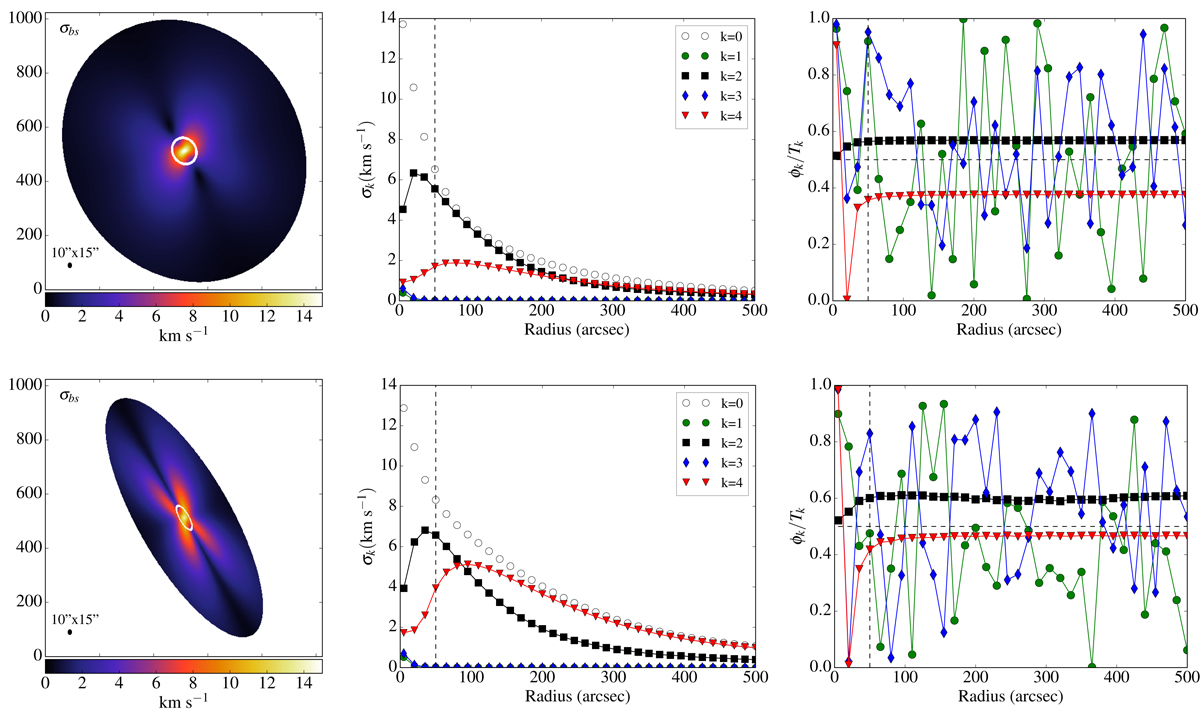
Results of the FFTs applied to the BS dispersion maps σbs, as built from disc models projected at 30° (top row) and 70° (bottom row). Left panel: map of σbs. The synthesised beam adopted in the toy model is shown on the bottom left corner. Middle panel: amplitudes of the Fourier modes for orders k = 0 to k = 4. Right panel: phase angles of the Fourier modes. A horizontal dashed line shows the half period of the Fourier modes. The disc scale-length is shown as a white contour (left) and as a vertical dashed line (middle and right).
Current usage metrics show cumulative count of Article Views (full-text article views including HTML views, PDF and ePub downloads, according to the available data) and Abstracts Views on Vision4Press platform.
Data correspond to usage on the plateform after 2015. The current usage metrics is available 48-96 hours after online publication and is updated daily on week days.
Initial download of the metrics may take a while.