Open Access
Fig. 8
Download original image
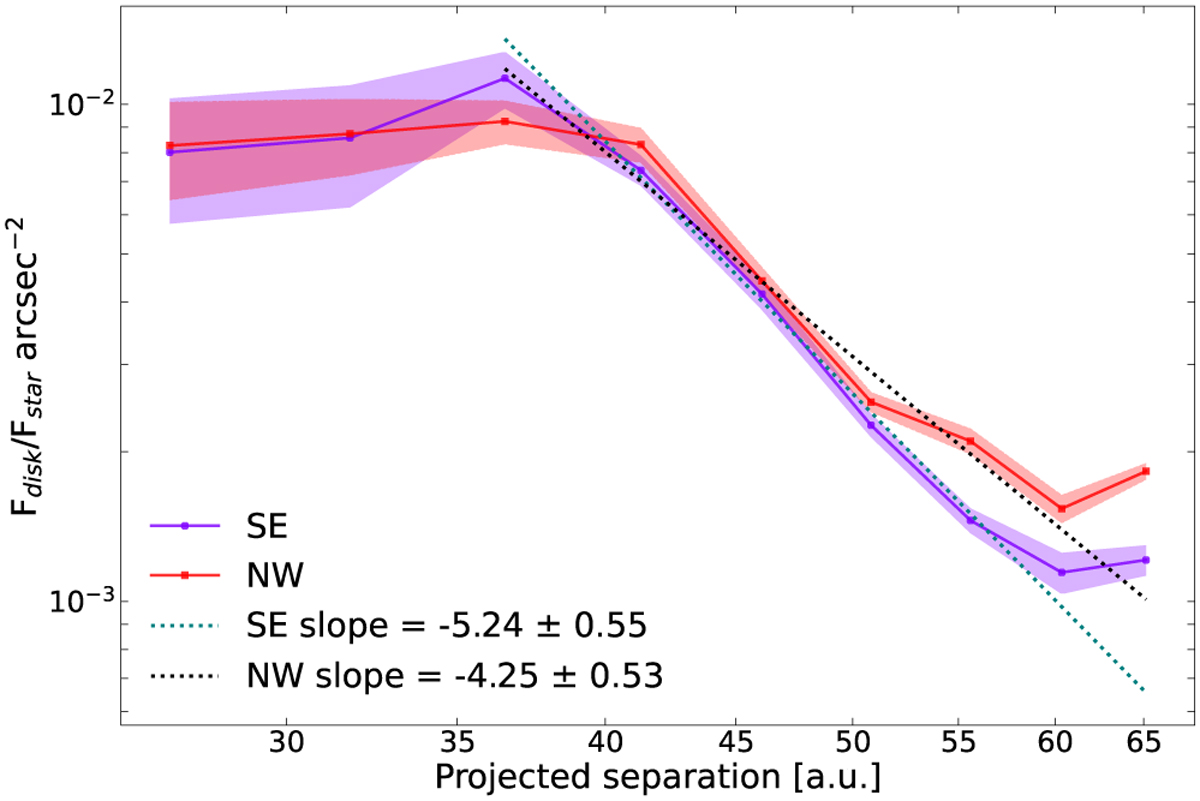
Surface brightness of the SE (purple) and NW (red) sides of the disk from the 2015-04-12 H23 IRDIS data reduced using RDI-PCA with temporal-mean correction and 125 PCs. The slope of the surface brightness in logarithmic scale is overlaid with dotted lines (SE, teal; NW, black).
Current usage metrics show cumulative count of Article Views (full-text article views including HTML views, PDF and ePub downloads, according to the available data) and Abstracts Views on Vision4Press platform.
Data correspond to usage on the plateform after 2015. The current usage metrics is available 48-96 hours after online publication and is updated daily on week days.
Initial download of the metrics may take a while.