Open Access
Fig. 6
Download original image
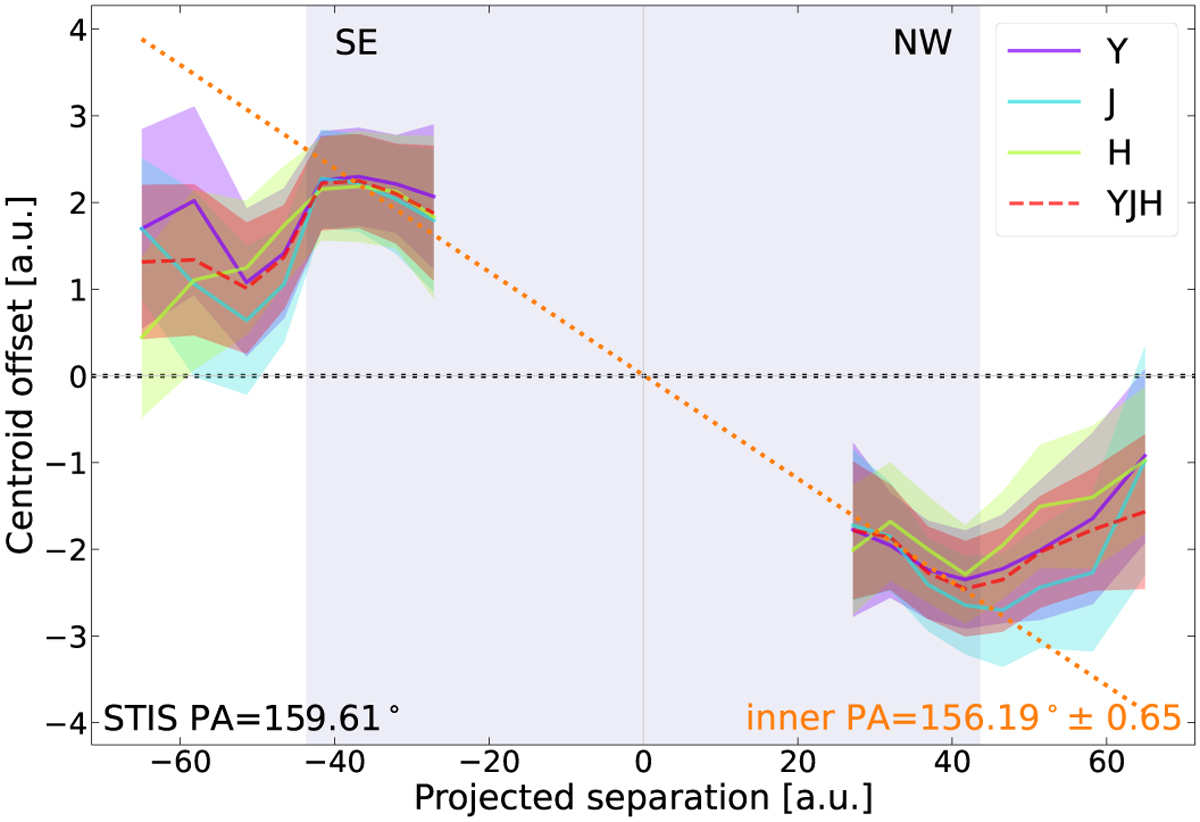
Spine position measured from Y (purple), J (cyan), H (lime), and combined YJH (red) band images, with the mean PA of the different bands and number of PCs fit across both sides of the disk (orange). A grey shaded box shows the region used to fit the PA of the inner disk component.
Current usage metrics show cumulative count of Article Views (full-text article views including HTML views, PDF and ePub downloads, according to the available data) and Abstracts Views on Vision4Press platform.
Data correspond to usage on the plateform after 2015. The current usage metrics is available 48-96 hours after online publication and is updated daily on week days.
Initial download of the metrics may take a while.