Fig. 3.
Download original image
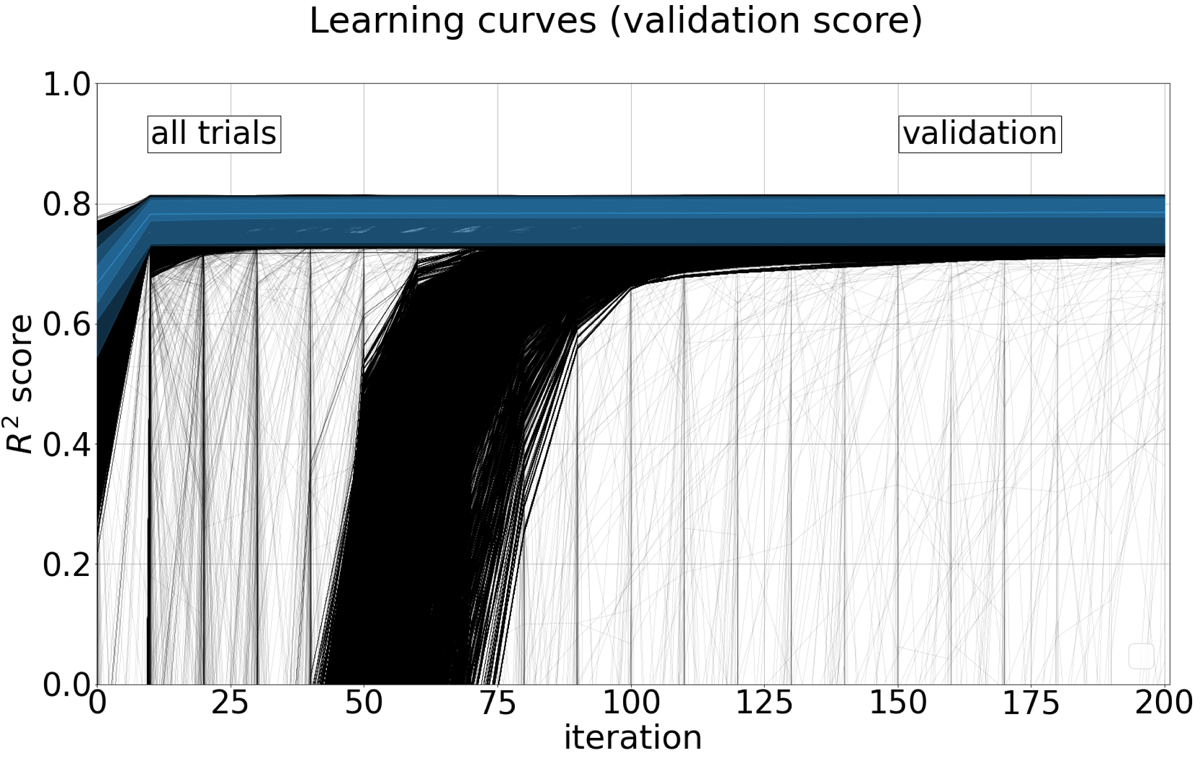
Validation scores for all considered hyperparameter configurations with ten neurons and all 10 trials for yrec = vp. Each individual trial is shown with a thin black line. The hyperparameter combination with the highest final median validation score is plotted in blue. In addition, the median and three overlapping confidence intervals (15.9th–84.1th percentilel, 2.5th–97.5th percentiles, and 0th–100th percentiles) range are shown in overlapping blue shaded regions.
Current usage metrics show cumulative count of Article Views (full-text article views including HTML views, PDF and ePub downloads, according to the available data) and Abstracts Views on Vision4Press platform.
Data correspond to usage on the plateform after 2015. The current usage metrics is available 48-96 hours after online publication and is updated daily on week days.
Initial download of the metrics may take a while.