Fig. 9
Download original image
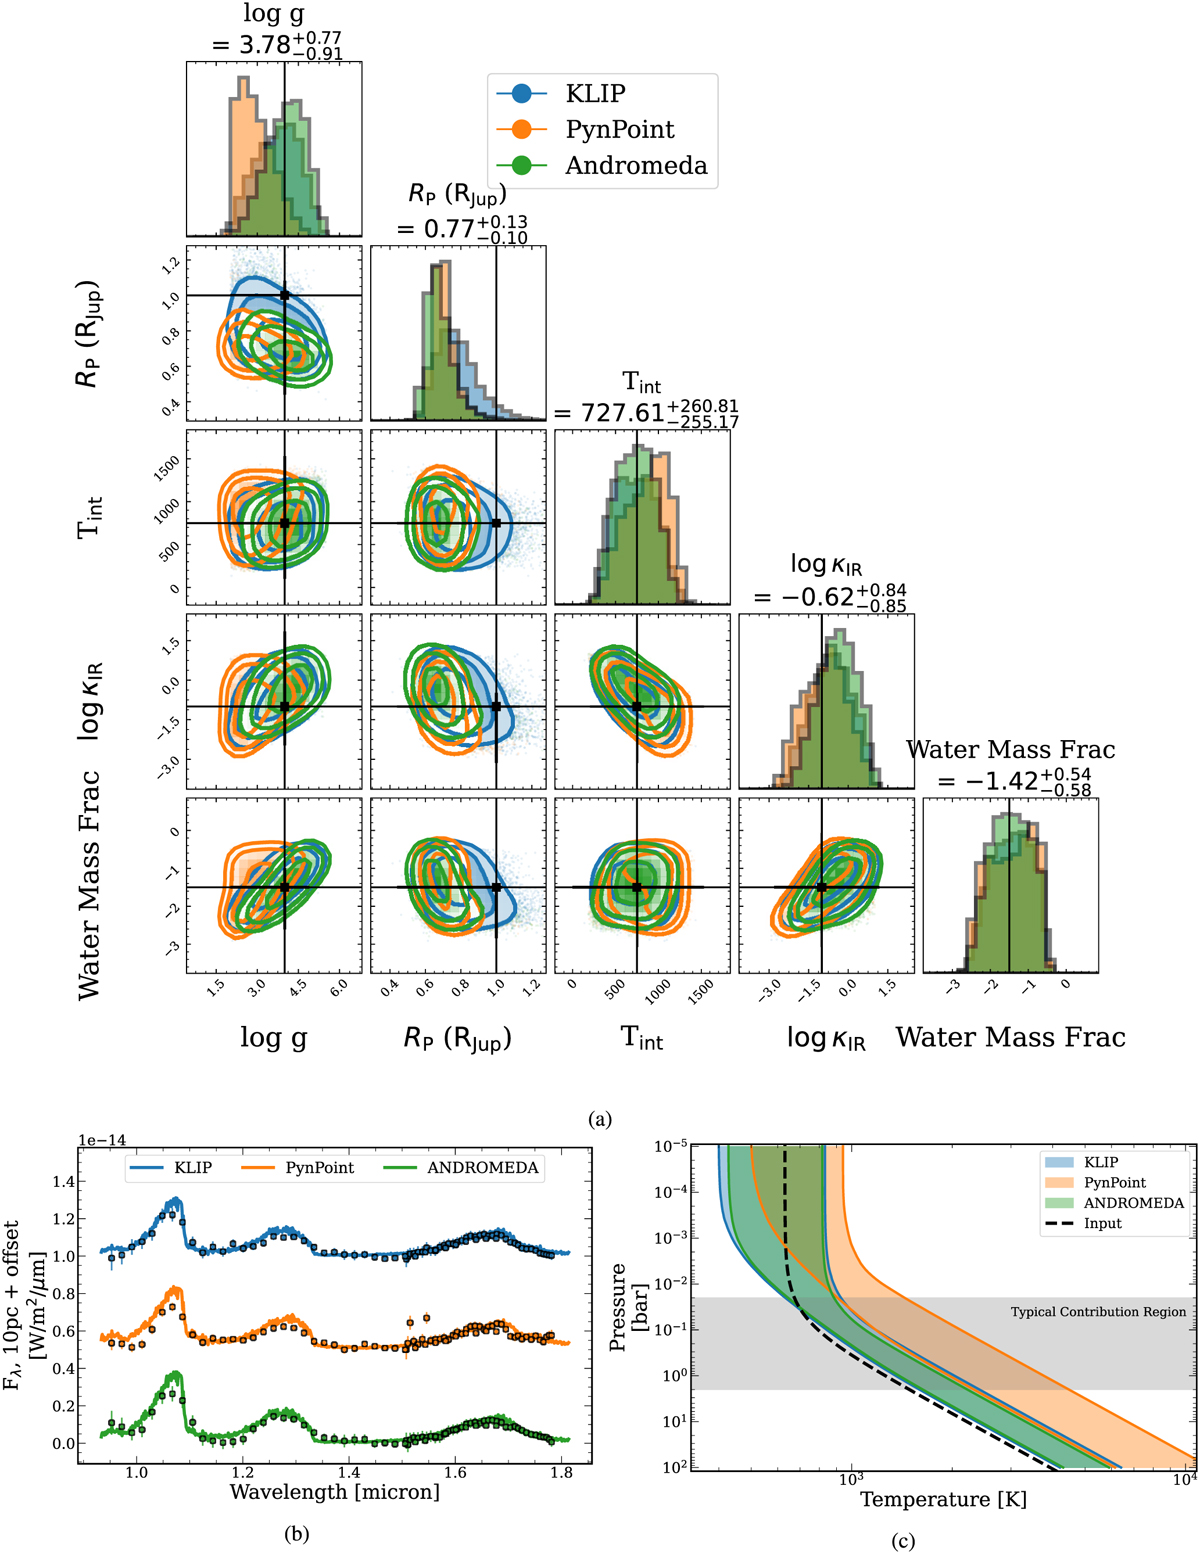
Results of retrievals comparing each of the three data processing algorithms. (a) Posterior distributions for retrievals from each data processing algorithm. Contours are plotted for 2D Gaussian 1, 2 and 3σ levels, corresponding to 36%, 86% and 99% confidence intervals, and the ground truth value is marked in black. The text labels correspond to the KLIP retrieval. (b) Median-fit spectrum from retrievals on each algorithm, with the covariance (other than for ANDROMEDA). (c) P–T Profiles for each retrieval. The shaded region indicates the 68% confidence region for the retrieved profile.
Current usage metrics show cumulative count of Article Views (full-text article views including HTML views, PDF and ePub downloads, according to the available data) and Abstracts Views on Vision4Press platform.
Data correspond to usage on the plateform after 2015. The current usage metrics is available 48-96 hours after online publication and is updated daily on week days.
Initial download of the metrics may take a while.