Fig. 8
Download original image
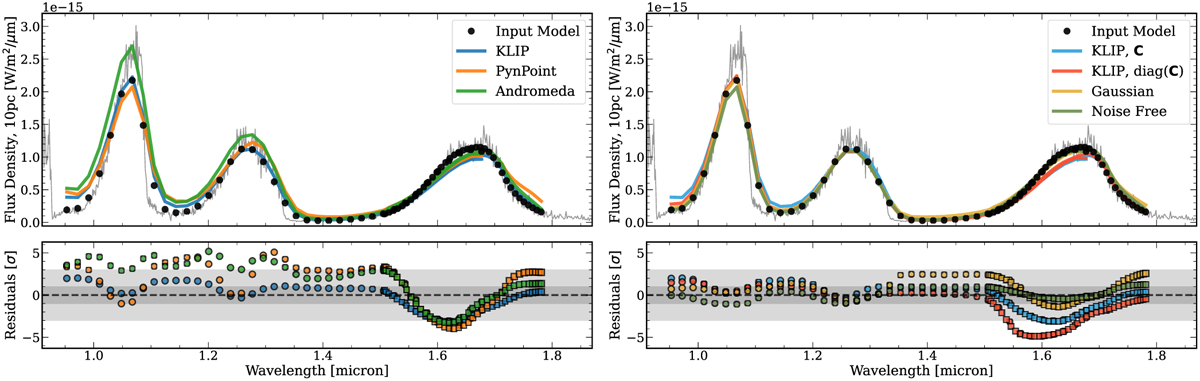
Best-fit models compared to the ground truth spectrum, in order to determine how well the retrieval can account for the systematics introduced through the data analysis. The residuals are calculated by sampling the posterior distributions to generate spectra, and taking the standard deviation at each wavelength. Left: the best fit from the retrievals for each KLIP (blue), PynPoint (orange) and ANDROMEDA (green). Right: the best fits of the KLIP retrievals with (blue) and without (yellow) including the covariance matrix, as well as the retrieval on the Gaussian noise (red) and Noise-free datasets (green). These are again compared to the true input spectrum.
Current usage metrics show cumulative count of Article Views (full-text article views including HTML views, PDF and ePub downloads, according to the available data) and Abstracts Views on Vision4Press platform.
Data correspond to usage on the plateform after 2015. The current usage metrics is available 48-96 hours after online publication and is updated daily on week days.
Initial download of the metrics may take a while.