Open Access
Fig. 7
Download original image
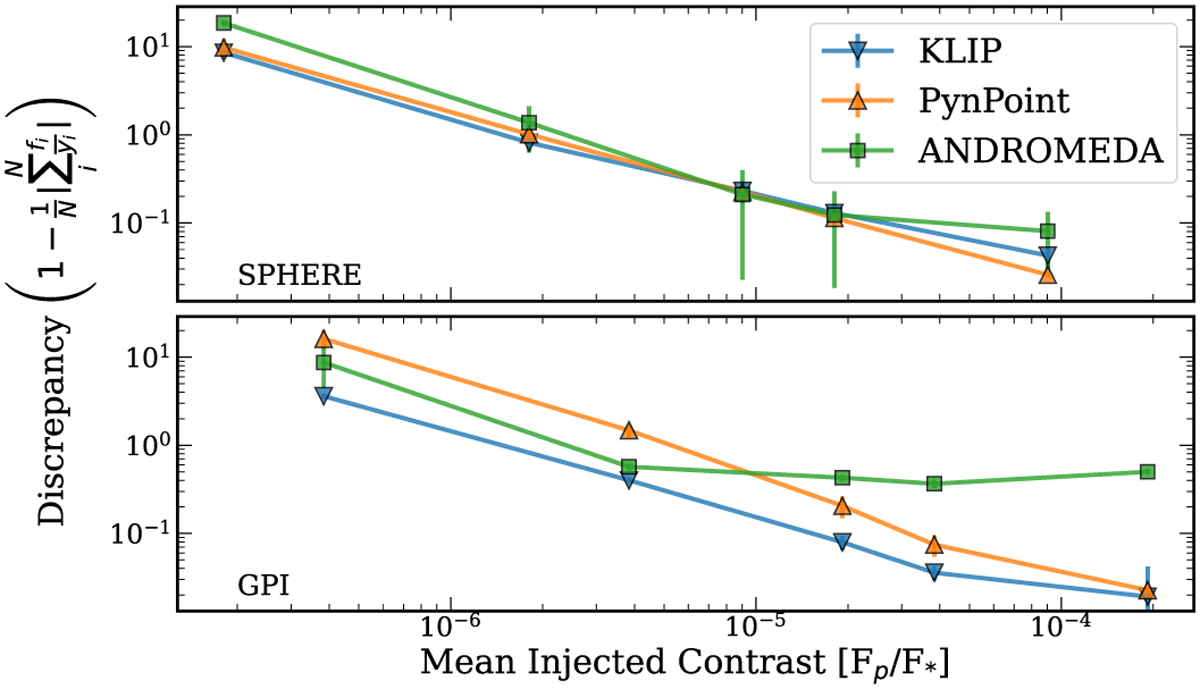
Best-fit discrepancy (Eq. (6)) as a function of input contrast at 400 mas. The top panel shows the results for injections into the SPHERE data cube, while the bottom is for GPI. The injections were repeated at three position angles, and the uncertainty presented is the standard deviation of these measurements.
Current usage metrics show cumulative count of Article Views (full-text article views including HTML views, PDF and ePub downloads, according to the available data) and Abstracts Views on Vision4Press platform.
Data correspond to usage on the plateform after 2015. The current usage metrics is available 48-96 hours after online publication and is updated daily on week days.
Initial download of the metrics may take a while.