Fig. 5
Download original image
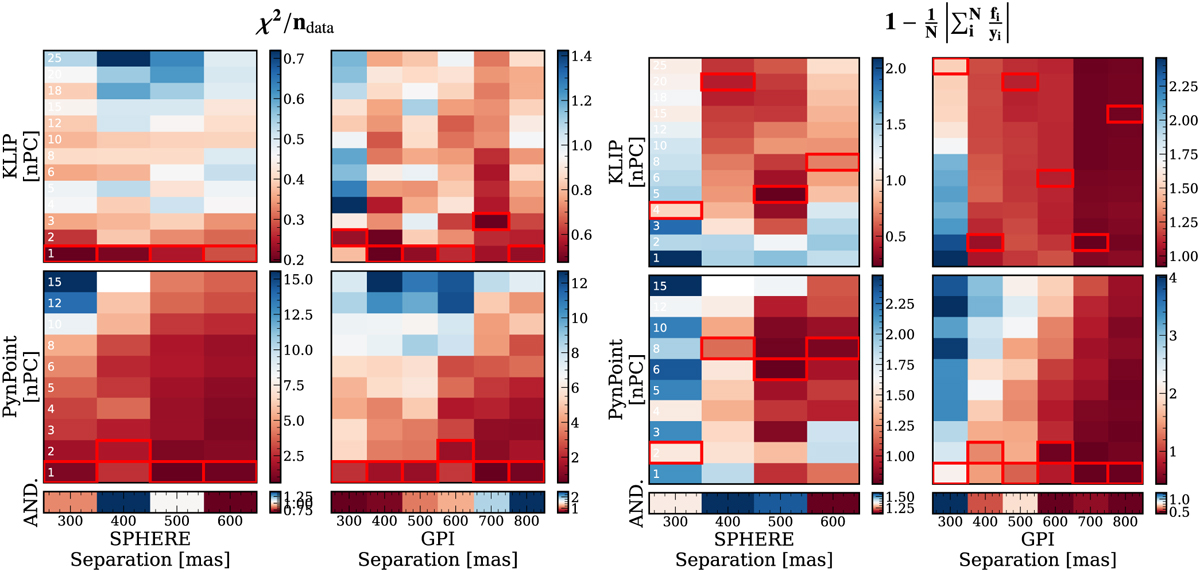
Goodness-of-fit metrics mapped across separation and number of principal components. The colour scale indicates median metric value from the injections at 4 separate position angles. The range of the colour scale for each sub plot is different in order to capture the variation within a single map. Highlighted in red are the optimal extractions for each separation. Left: χ2/ndata map. Right: the same as the left panel, but calculated using the relative discrepancy (e) instead of the χ2.
Current usage metrics show cumulative count of Article Views (full-text article views including HTML views, PDF and ePub downloads, according to the available data) and Abstracts Views on Vision4Press platform.
Data correspond to usage on the plateform after 2015. The current usage metrics is available 48-96 hours after online publication and is updated daily on week days.
Initial download of the metrics may take a while.