Fig. 4
Download original image
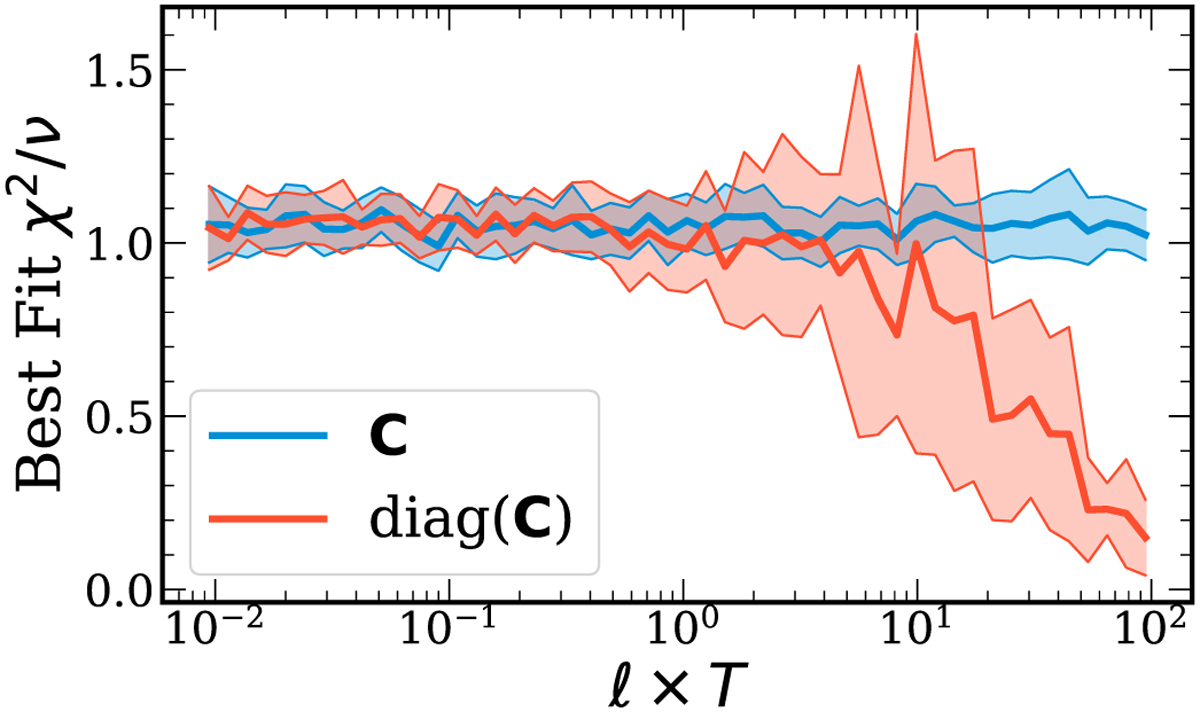
Best fit χ2/v as a function of the ratio between the correlation length scale (proportional to 1/ℓ) and the period, T. The χ2 was computed for fits of Eq. (4) to data perturbed by draws from the covariance matrix, varying the correlation length scale. For each ℓ, 25 Multinest retrievals were run in order to compute the uncertainty on the χ2, shown as the shaded region around the mean. In blue, the covariance is properly accounted for in the likelihood, while in orange only the diagonal of the covariance is used in the likelihood. In order for the reduced χ2 to be a useful metric, the covariance must be properly accounted for.
Current usage metrics show cumulative count of Article Views (full-text article views including HTML views, PDF and ePub downloads, according to the available data) and Abstracts Views on Vision4Press platform.
Data correspond to usage on the plateform after 2015. The current usage metrics is available 48-96 hours after online publication and is updated daily on week days.
Initial download of the metrics may take a while.