Fig. 3
Download original image
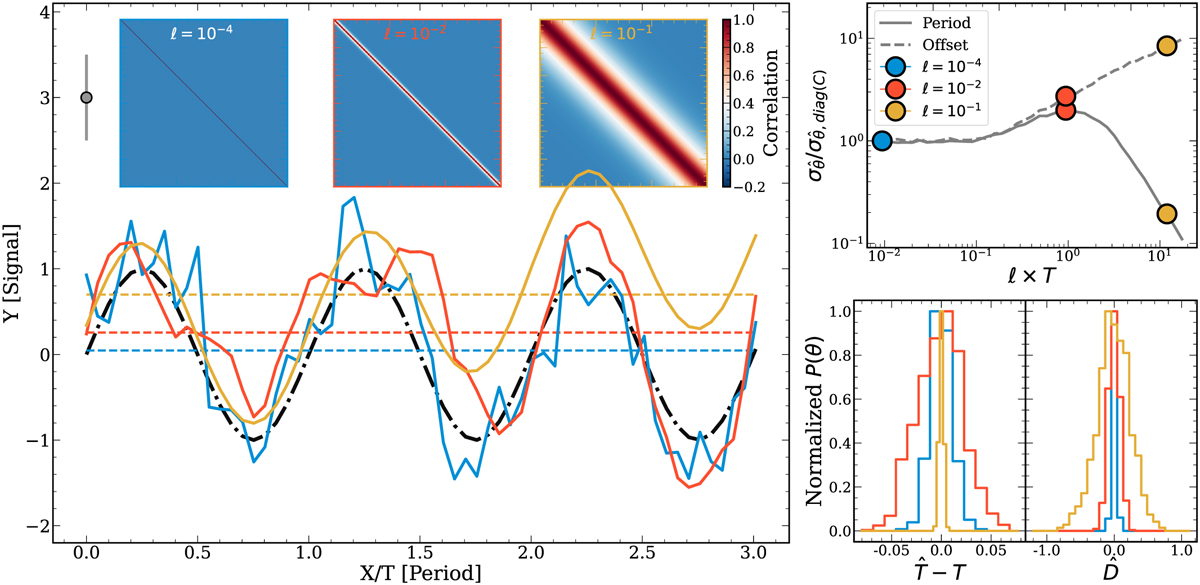
Toy model for demonstrating the effect of correlated uncertainties. Left: data drawn from a toy sinusoidal model (Eq. (4)) when considering three cases of covariance in the data. The first (blue) is data drawn from a univariate Gaussian distribution with no correlations, as shown in the left inset. The second (orange) is drawn from a multivariate Gaussian distribution where the correlation length scale – as defined by the ℓ parameter of the Matérn kernel (Eq. (5)) – is less than the period of the model (centre inset). The third (yellow) is drawn from a multivariate Gaussian distribution with a correlation length scale greater than the period of the model (right inset). In the background the true input is plotted in gray. The gray datapoint indicates the 1σ error bar associated with each data point. Right: in the top panel, the posterior width of the period (solid gray line) and offset (dashed gray line) parameters scaled to the uncorrelated case as a function of the ratio between the correlation length scale and the period of the sine (so the model length scale). Marked in blue, orange and yellow are the draws plotted in the right panel. The histograms in the bottom panel are the posterior histograms for the period (left) and offset (right) for each of the highlighted cases.
Current usage metrics show cumulative count of Article Views (full-text article views including HTML views, PDF and ePub downloads, according to the available data) and Abstracts Views on Vision4Press platform.
Data correspond to usage on the plateform after 2015. The current usage metrics is available 48-96 hours after online publication and is updated daily on week days.
Initial download of the metrics may take a while.