Fig. 2
Download original image
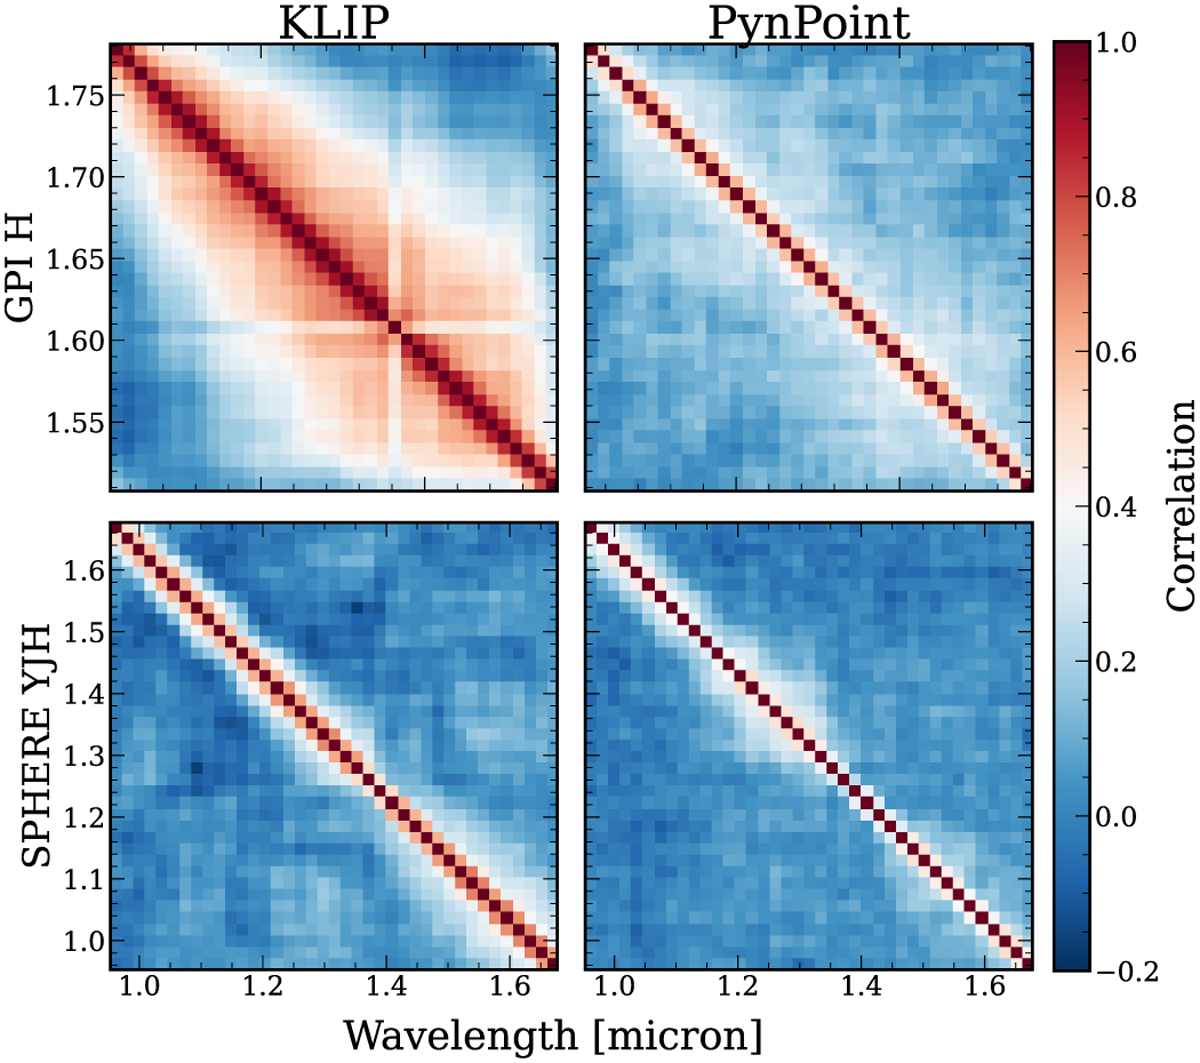
Correlation matrices for each dataset for HR 8799 e, with the GPI H-band data shown in the top row and the SPHERE YJH data on the bottom. Following the processing using KLIP (left) or PynPoint (right), we calculate the correlation and covariance matrices as described in Sect. 3.2. The correlation is computed as in Eq. (2). The GPI data is more strongly correlated than the SPHERE data, particularly following the KLIP processing. The SPHERE data shows structure similar to the correlation matrix, with the correlation width following the shape of the water absorption spectrum.
Current usage metrics show cumulative count of Article Views (full-text article views including HTML views, PDF and ePub downloads, according to the available data) and Abstracts Views on Vision4Press platform.
Data correspond to usage on the plateform after 2015. The current usage metrics is available 48-96 hours after online publication and is updated daily on week days.
Initial download of the metrics may take a while.