Fig. 10
Download original image
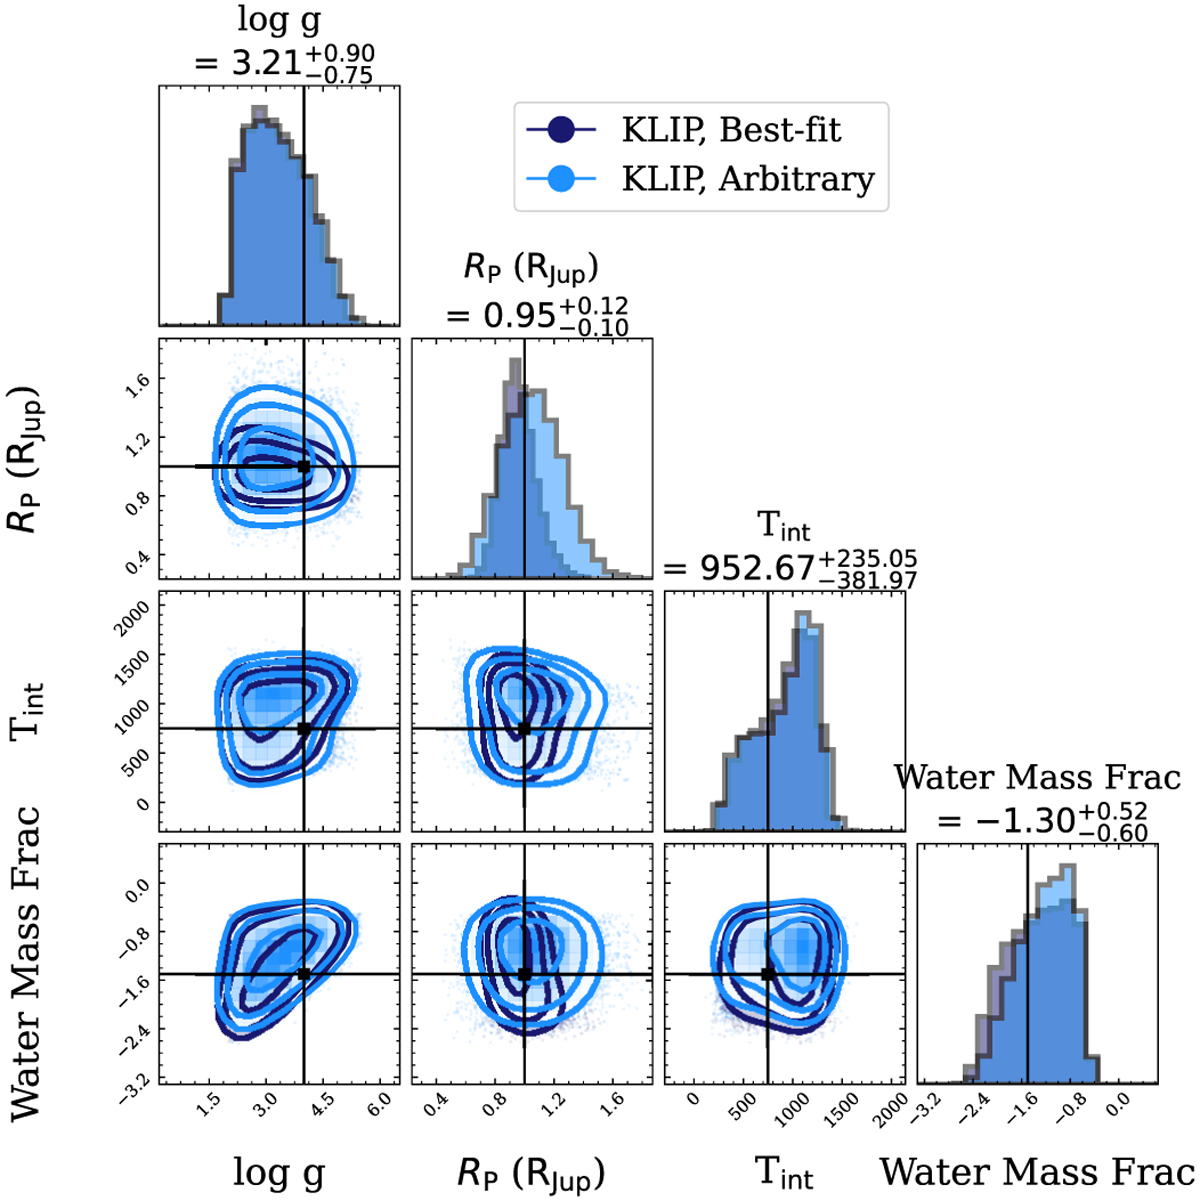
Corner plot comparing the retrieved parameter distributions for two different KLIP reductions. In light blue, the input spectrum was optimised using the relative discrepancy metric (Fig. 5), while in dark blue an arbitrary extraction was chosen for each of the SPHERE and GPI datasets, reflecting a non-optimal parameter selection.
Current usage metrics show cumulative count of Article Views (full-text article views including HTML views, PDF and ePub downloads, according to the available data) and Abstracts Views on Vision4Press platform.
Data correspond to usage on the plateform after 2015. The current usage metrics is available 48-96 hours after online publication and is updated daily on week days.
Initial download of the metrics may take a while.