Fig. 1
Download original image
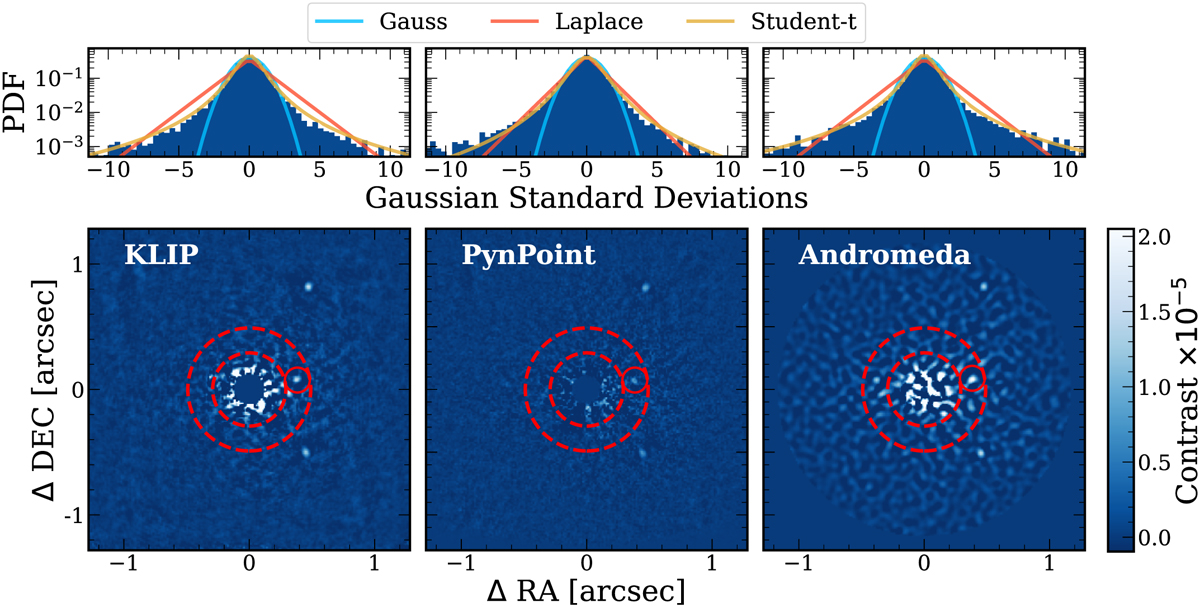
Single wavelength channel from the GPI H-band data of the HR 8799 system, post-processed with KLIP (left), PynPoint (centre) and Andromeda (right). The solid red circle denotes the position of HR 8799 e as computed using the pyKLIP astrometry module. Marked in red dashed lines are the regions which are compared when finding the mean correlation between different wavelength channels. At the top of the figure, histograms of the residuals are plotted in units of σ. The light blue line is a Gaussian fit with the width defined as the Gaussian standard deviation of the residual frame below.
Current usage metrics show cumulative count of Article Views (full-text article views including HTML views, PDF and ePub downloads, according to the available data) and Abstracts Views on Vision4Press platform.
Data correspond to usage on the plateform after 2015. The current usage metrics is available 48-96 hours after online publication and is updated daily on week days.
Initial download of the metrics may take a while.