Fig. 6.
Download original image
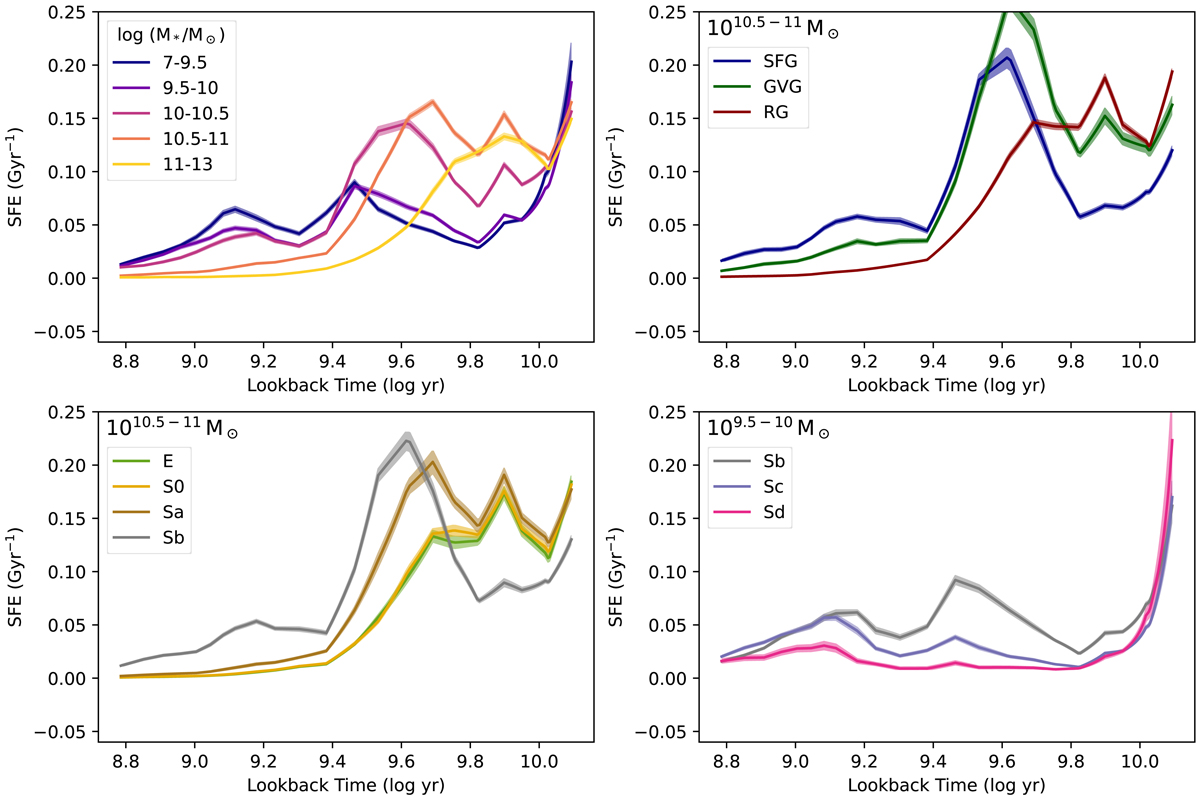
SFE histories for different bins of galaxies. In each panel the X-axis is the look-back time in log and the Y-axis the SFR divided by the total amount of gas present at each time as predicted by the model. In the top left panel, we show the galaxies divided into stellar mass bins, in the top right panel we show one mass bin (1010.5 − 11 M⊙) divided into current SFS bins, in the bottom left panel we show the same mass bin divided into four morphology bins (E–Sb) and in the bottom right panel we show a different mass bin (1010.5 − 11 M⊙) divided into the Sb, Sc and Sd morphology bins.
Current usage metrics show cumulative count of Article Views (full-text article views including HTML views, PDF and ePub downloads, according to the available data) and Abstracts Views on Vision4Press platform.
Data correspond to usage on the plateform after 2015. The current usage metrics is available 48-96 hours after online publication and is updated daily on week days.
Initial download of the metrics may take a while.