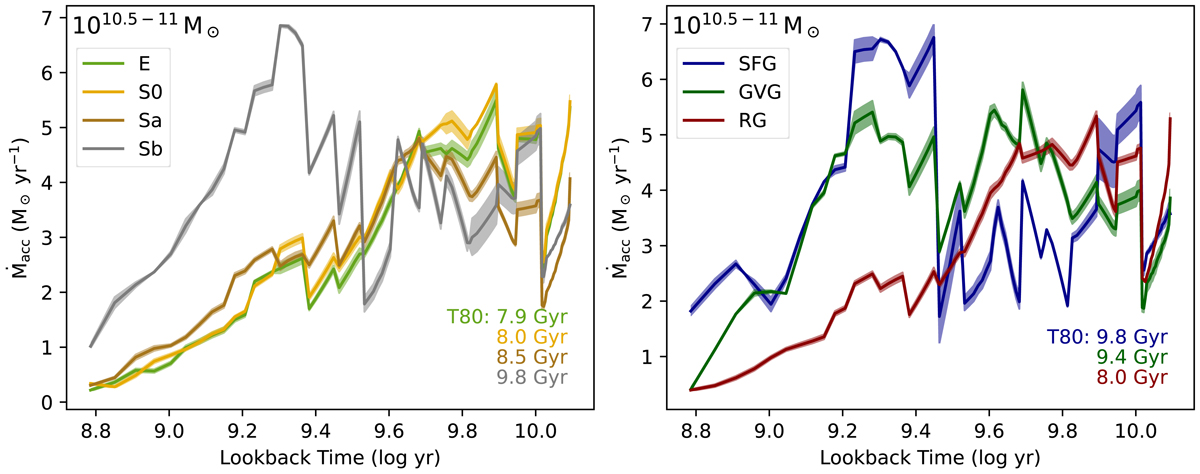
Fig. 5.
Download original image
Accretion rate histories for different morphology (left panel) and SFS (right panel) bins at a fixed mass bin of 1010.5 − 11 M⊙. In the bottom right corner of each panel, we show the 80 of the accretion histories, defined in Sect. 3.2. In both panels the shaded areas correspond to the uncertainties derived from the error of the average value in the ChEHs and SFHs.
Current usage metrics show cumulative count of Article Views (full-text article views including HTML views, PDF and ePub downloads, according to the available data) and Abstracts Views on Vision4Press platform.
Data correspond to usage on the plateform after 2015. The current usage metrics is available 48-96 hours after online publication and is updated daily on week days.
Initial download of the metrics may take a while.