Open Access
Fig. 3.
Download original image
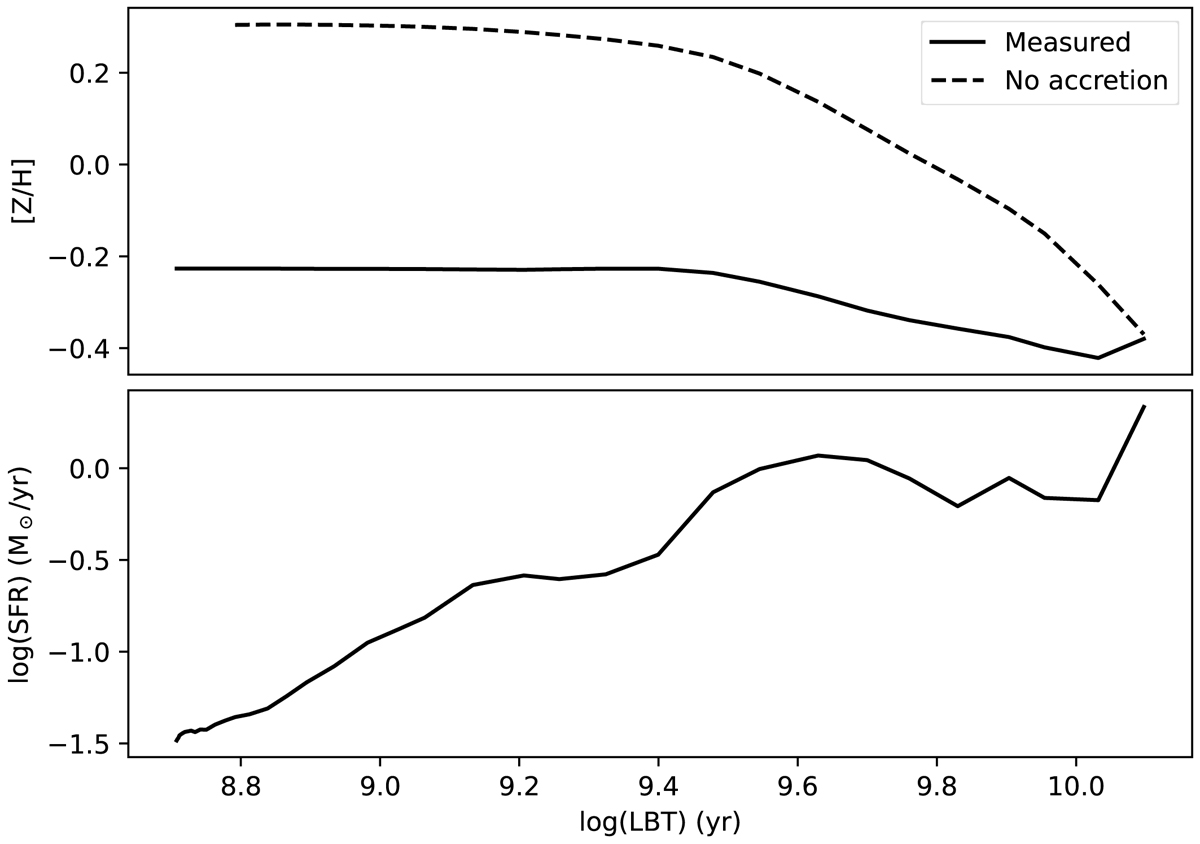
Set of ChEH (top) and SFH (bottom) corresponding to the averaged histories of all galaxies in our sample. In the top panel, the solid line corresponds to out measured ChEH and the dashed line to the predicted enrichment history in the absence of dilution from pristine gas accretion.
Current usage metrics show cumulative count of Article Views (full-text article views including HTML views, PDF and ePub downloads, according to the available data) and Abstracts Views on Vision4Press platform.
Data correspond to usage on the plateform after 2015. The current usage metrics is available 48-96 hours after online publication and is updated daily on week days.
Initial download of the metrics may take a while.