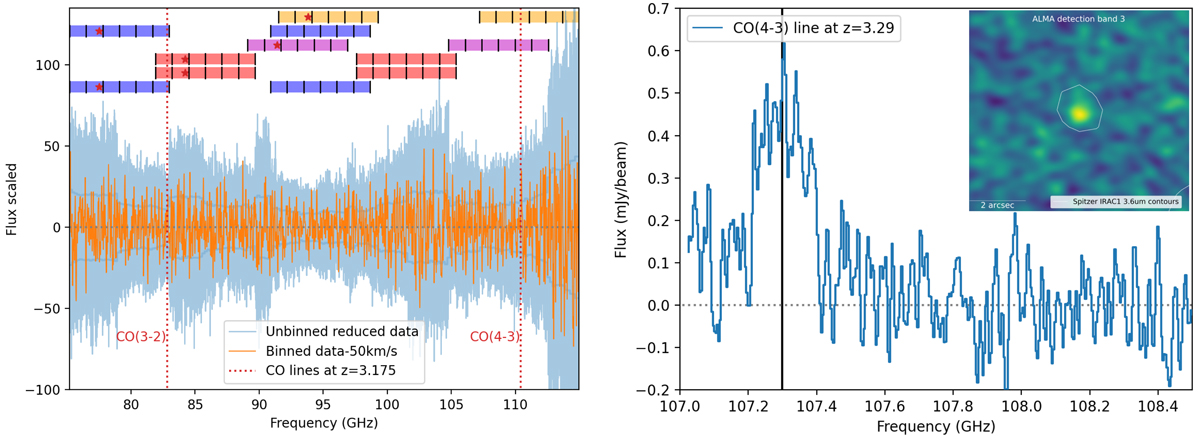
Fig. B.1.
Download original image
Reduced millimetre spectra of CVLA958 and CVLA100 observed by the IRAM 30m and ALMA telescopes. The IRAM spectrum for CVLA958 is shown, with its unbinned reduced spectrum presented in blue, and the orange line corresponds to the Gaussian filtered spectrum using a width of 50 km/s (left panel). The CO lines for the redshift solution of z = 3.1755 provided by Birkin et al. (2021) are depicted with the dashed red lines. The applied FTS setups are presented at the top of the plot and are coloured according to the adopted configuration and observing date. The ALMA spectrum for CVLA100 at band 3 is shown in the right panel. The vertical black line corresponds to the possible CO(4-3) emission line at z = 3.29, located at ν = 107.3 GHz. The inset cutout illustrates the velocity-integrated map of the line emission, and the Spitzer 3.6 μm contour (white isocontour) is overlaid.
Current usage metrics show cumulative count of Article Views (full-text article views including HTML views, PDF and ePub downloads, according to the available data) and Abstracts Views on Vision4Press platform.
Data correspond to usage on the plateform after 2015. The current usage metrics is available 48-96 hours after online publication and is updated daily on week days.
Initial download of the metrics may take a while.