Fig. 6.
Download original image
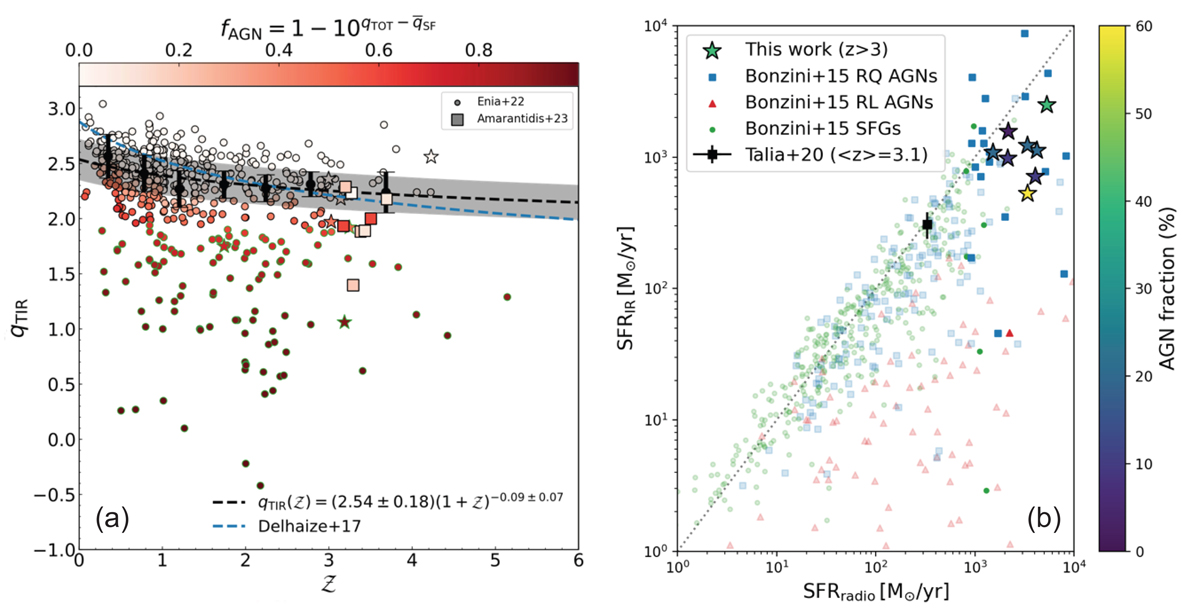
The qTIR parameter over redshift for the sample explored by Enia et al. (2022) and for our 8 galaxies (panel a). This figure was retrieved by Enia et al. (2022), published under the CC BY 4.0 international licence and was modified by adding the results from our work (square points). The dashed black line and grey shaded region correspond to the best-fit relation of their total sample and the standard deviation, respectively, while the dashed blue line shows a similar relation by Delhaize et al. (2017). All points by Enia et al. (2022) are coloured according to the contribution of AGN to the radio emission defined as ![]() , with qtot and
, with qtot and ![]() corresponding to the qTIR and its evolution with redshift, respectively. The star symbols depict what is defined by Enia et al. (2022) as H-dark sources (i.e., not detected at the Hubble-WFC3 H-band). Panel b, presents the SFRs derived from the IR and radio luminosity, for the 8 sources of our sample, along with the results by Bonzini et al. (2015) (radio-quiet AGN: blue squares, radio-loud AGN: red triangles, SF galaxies: green circles) and Talia et al. (2021) (average values of their sample). All data points with redshift below 3 are coloured with transparency, while the ones with z > 3 have normal colours.
corresponding to the qTIR and its evolution with redshift, respectively. The star symbols depict what is defined by Enia et al. (2022) as H-dark sources (i.e., not detected at the Hubble-WFC3 H-band). Panel b, presents the SFRs derived from the IR and radio luminosity, for the 8 sources of our sample, along with the results by Bonzini et al. (2015) (radio-quiet AGN: blue squares, radio-loud AGN: red triangles, SF galaxies: green circles) and Talia et al. (2021) (average values of their sample). All data points with redshift below 3 are coloured with transparency, while the ones with z > 3 have normal colours.
Current usage metrics show cumulative count of Article Views (full-text article views including HTML views, PDF and ePub downloads, according to the available data) and Abstracts Views on Vision4Press platform.
Data correspond to usage on the plateform after 2015. The current usage metrics is available 48-96 hours after online publication and is updated daily on week days.
Initial download of the metrics may take a while.