Fig. 5.
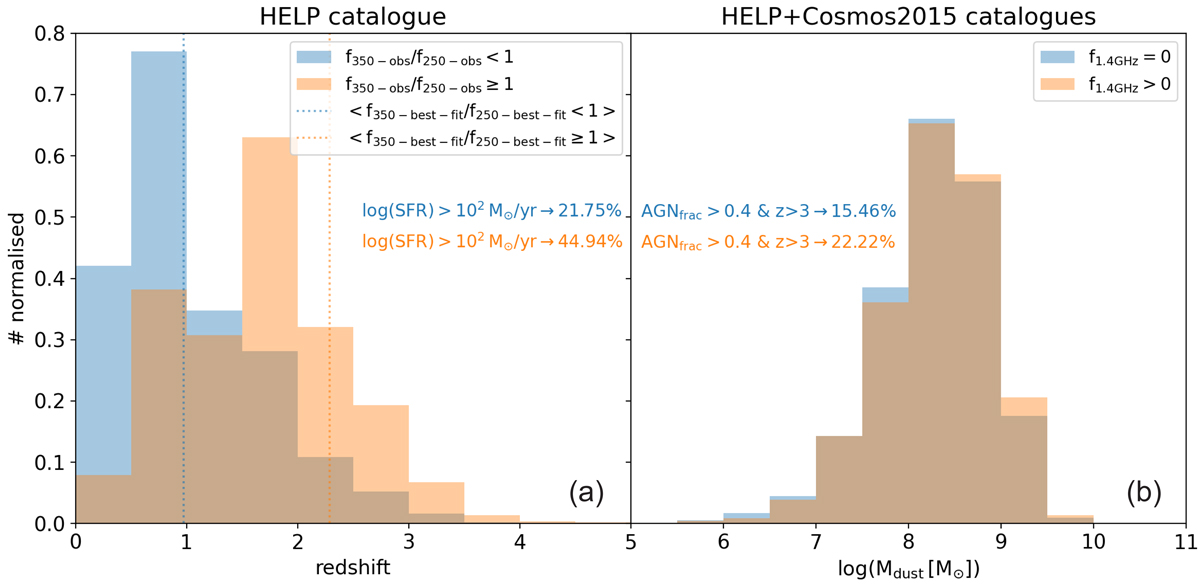
Download original image
Normalised redshift histograms of all galaxies from the HELP catalogue (panel a), separated with the criterion f350 μm/f250 μm = 1. Flux densities were estimated using the Herschel observational data as provided from the same catalogue. The vertically dotted coloured lines correspond to the average values of the same histograms, employing the flux densities from the CIGALE best model fit, and are coloured accordingly. The text in the panel denotes the percentage of the sources that present an SFR above 102 M⊙ yr−1 and are coloured according to the aforementioned criterion. Panel b illustrates the normalised histograms for the dust content of the galaxies in both the HELP and Cosmos2015 catalogues. The blue and orange histograms are derived from galaxies without and with radio VLA 1.4 GHz emission, respectively. The text of the panel demonstrates the percentage of the galaxies that present an AGN component (AGNfrac > 40%) and are placed at z > 3.
Current usage metrics show cumulative count of Article Views (full-text article views including HTML views, PDF and ePub downloads, according to the available data) and Abstracts Views on Vision4Press platform.
Data correspond to usage on the plateform after 2015. The current usage metrics is available 48-96 hours after online publication and is updated daily on week days.
Initial download of the metrics may take a while.