Fig. 4.
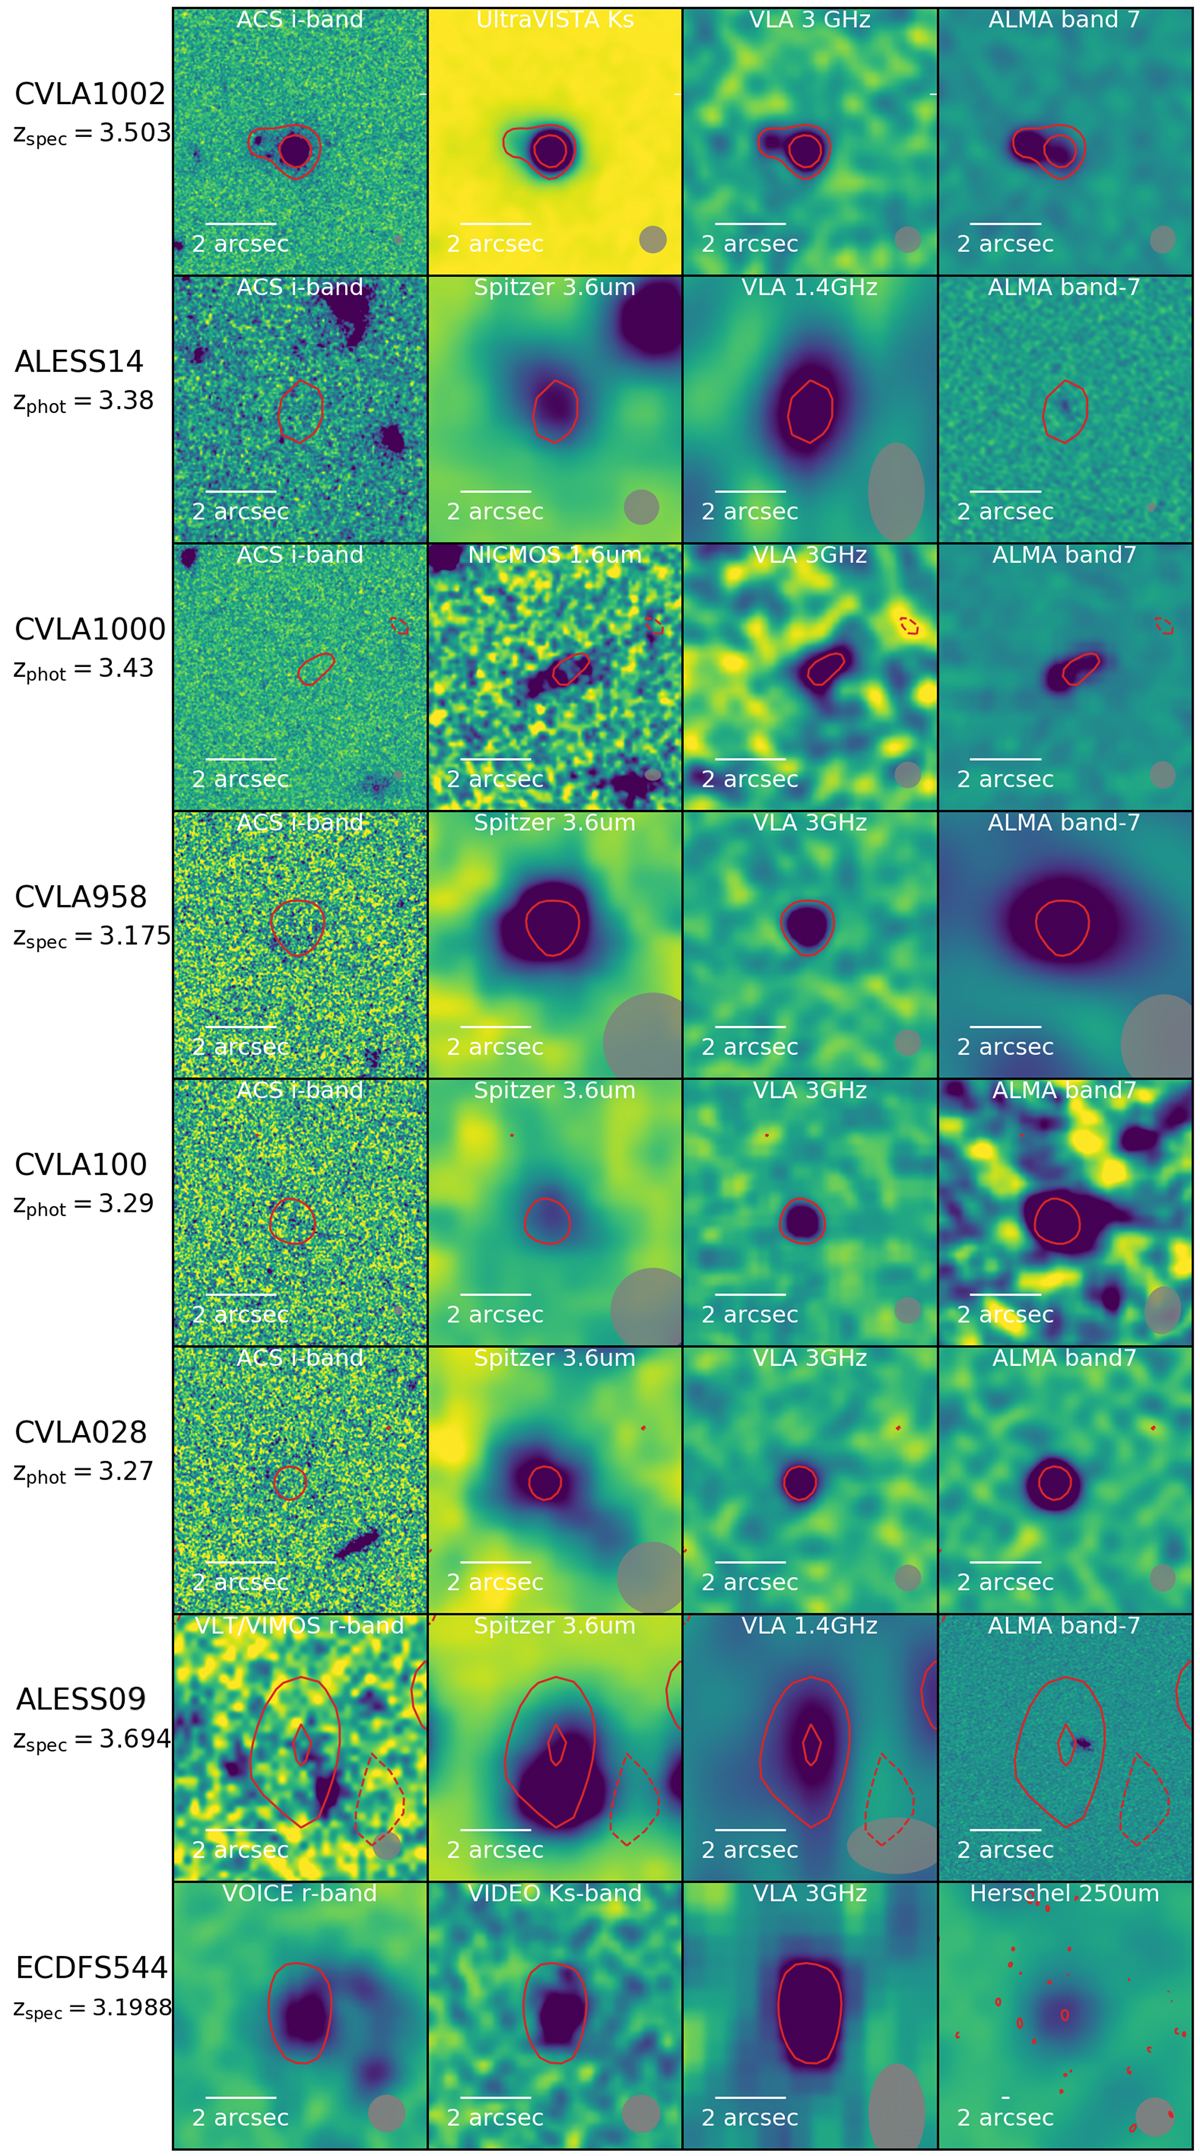
Download original image
Multi-wavelength view of the eight high-redshift galaxies of our sample, ordered according to Table 1. From left to right, we present the i- or r-band (HST, VIMOS, and VOICE data), the Spitzer 3.6 μm/VIDEO Ks-band/NICMOS 1.6 μm images, the radio VLA 1.4/3 GHz and the FIR data from ALMA and Herschel, and the red contours correspond to the VLA emission. From top to bottom, the contour levels of the radio image for each source are (7.715 × 10⁻⁶, 2.093 × 10⁻⁵), 2.827 × 10⁻⁵, (−4.710 × 10⁻⁶, 1.058 × 10⁻⁵), 5.640 × 10⁻⁶, (−4.845 × 10⁻⁶, 5.461 × 10⁻⁶), (−5.078 × 10⁻⁶, 1.407 × 10⁻⁵), (−4.633 × 10⁻⁶, 1.124 × 10⁻⁵, 2.712 × 10⁻⁵), and 2.092 × 10⁻⁵ Jy beam−1. Each panel has a size of 7.2 × 7.2 arcsec2, except for the Herschel image, which for visualisation purposes has a larger extent. Additionally, the beam size (shaded light grey area) of each instrument and a 2 arcsec scale bar are added in each panel. The ALMA data come from the projects AS2COSMOS and ALESS (Simpson et al. 2020; Hodge et al. 2013).
Current usage metrics show cumulative count of Article Views (full-text article views including HTML views, PDF and ePub downloads, according to the available data) and Abstracts Views on Vision4Press platform.
Data correspond to usage on the plateform after 2015. The current usage metrics is available 48-96 hours after online publication and is updated daily on week days.
Initial download of the metrics may take a while.