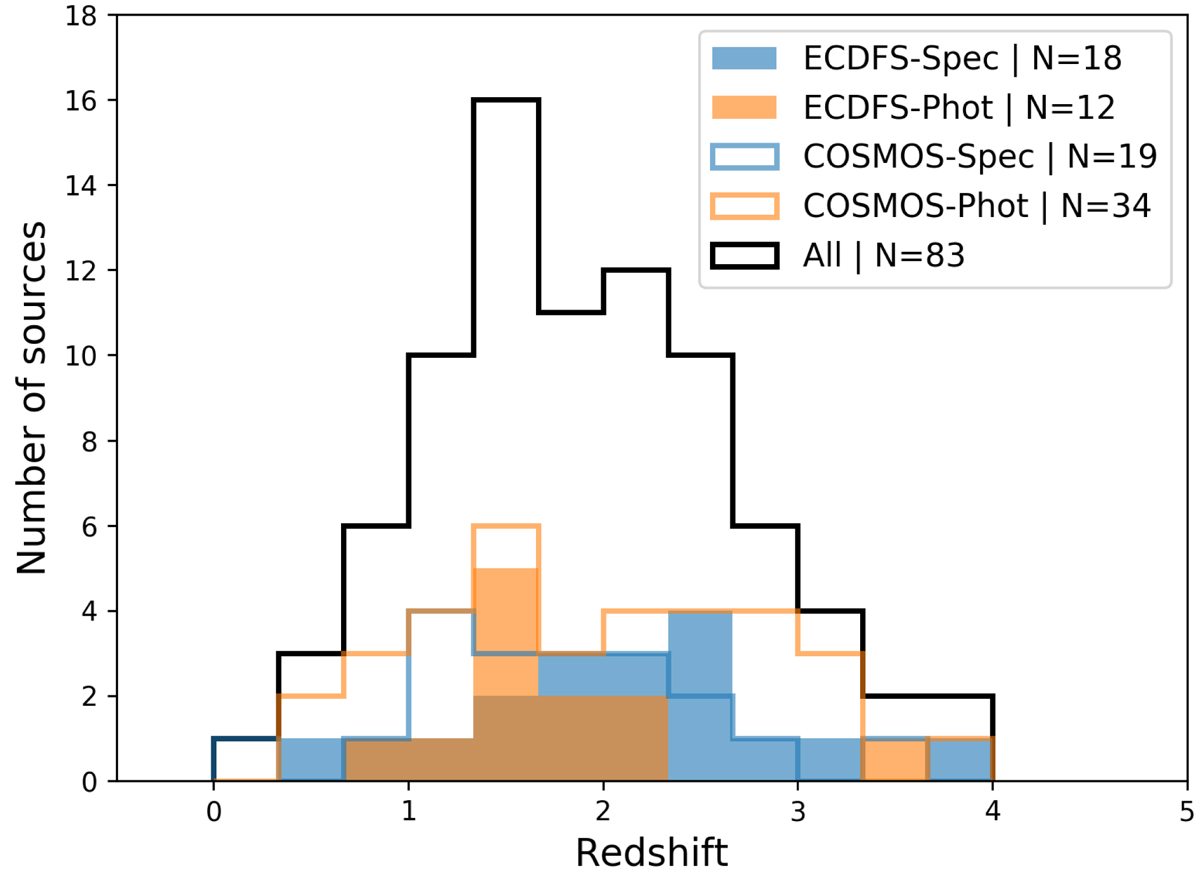
Fig. 2.
Download original image
Histograms presenting the number of sources for each redshift bin selected by the criteria for the COSMOS (empty histograms) and ECDF-S (filled histograms). The blue histograms correspond to spectroscopic values derived from the literature, and the orange histograms show the photometric values. The combined sample is depicted with an empty black histogram. The number of sources for each category is presented in the legend.
Current usage metrics show cumulative count of Article Views (full-text article views including HTML views, PDF and ePub downloads, according to the available data) and Abstracts Views on Vision4Press platform.
Data correspond to usage on the plateform after 2015. The current usage metrics is available 48-96 hours after online publication and is updated daily on week days.
Initial download of the metrics may take a while.