Fig. 1.
Download original image
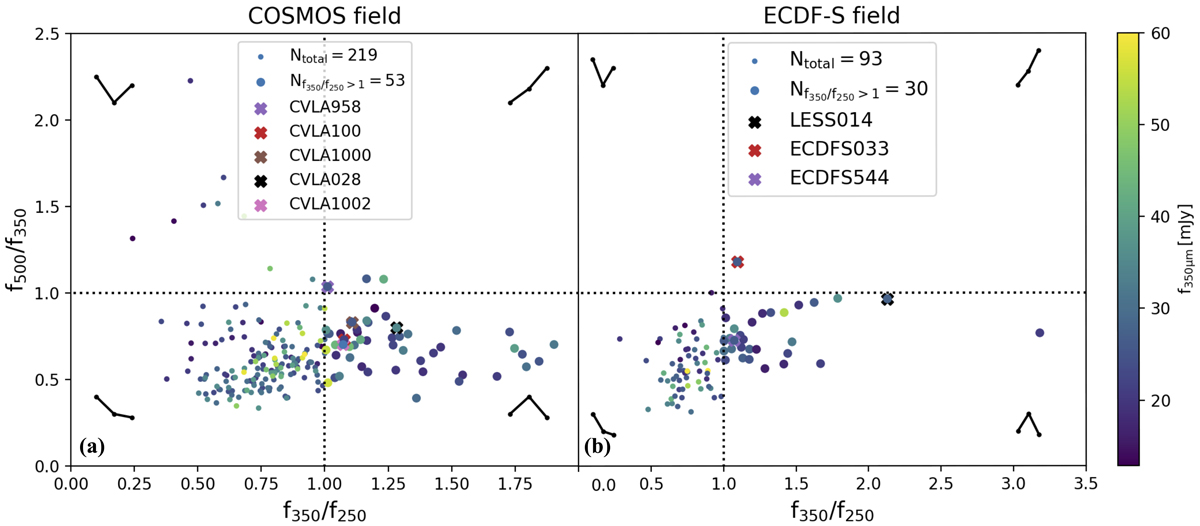
Flux density ratios of 350 and 250 μm vs. the ratios of 500 and 350 μm of HerMES in COSMOS (panel a) and ECDF-S (panel b). The sample was selected by cross-matching the HerMES catalogue with the VLA-COSMOS and VLA-ECDFS data. The dashed black lines indicate f350/f250 = 1 and f500/f350 = 1, while the points surpassing the limit of f350/f250 > 1 are presented with larger markers. The colour bar corresponds to the 350 μm flux of each source, and the legend shows the number of sources for each panel and the selected high-redshift candidates (crosses). The black lines in the subregion of each panel provide information regarding the shape of the far-IR (FIR) emission. For instance, sources with f500/f350 < 1 and f350/f250 > 1 have a peak in flux between 250 and 500 μm. The photometric properties of the sources presented in the legend are provided in Table 1.
Current usage metrics show cumulative count of Article Views (full-text article views including HTML views, PDF and ePub downloads, according to the available data) and Abstracts Views on Vision4Press platform.
Data correspond to usage on the plateform after 2015. The current usage metrics is available 48-96 hours after online publication and is updated daily on week days.
Initial download of the metrics may take a while.