Fig. 7.

Download original image
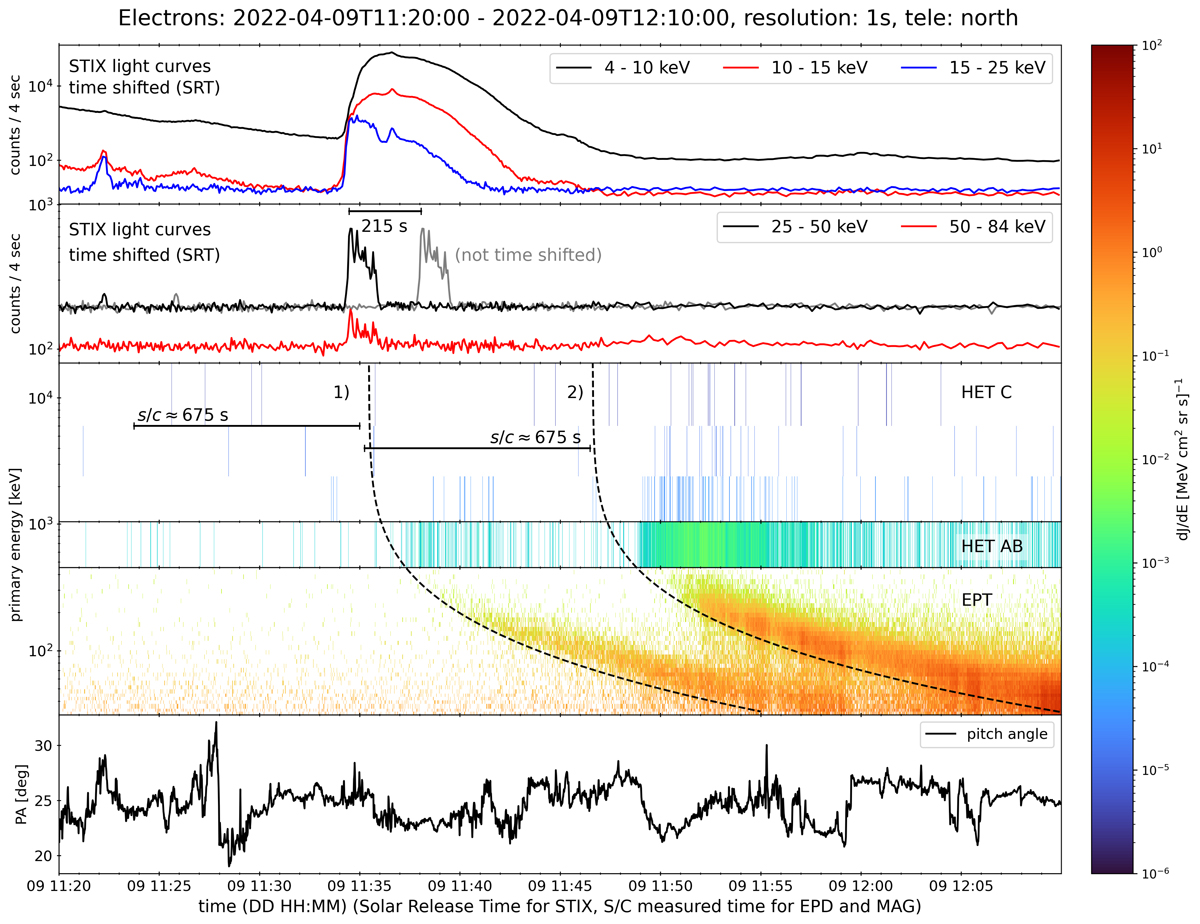
STIX X-ray light curves and their interplanetary counterparts. Top two panels: STIX light curves for the X-ray energies indicated by the legends, time-shifted by 215 s, i.e., in Solar Release Time (SRT). The gray 25–50 keV curve has not been time-shifted. Third panel (HET C): Electrons measured in the HET BGO crystal. The threshold for detection lies above 1 MeV, so these measurements are clear indications of relativistic electrons. Fourth panel (HET AB): Coincidence measurements of the HET A and B detectors; their energy range lies between ∼500 keV and 900 keV. Fifth panel (EPT): Electrons measured by EPT. See the main text for a discussion. Bottom panel: Central pitch angle covered by the EPD north telescopes. Note the narrow range of the y-axis. All in situ times are measurement times at Solar Orbiter. Dashed velocity dispersion curves are shown for the two electron injections, (1) and (2), as discussed in the text. Horizontal black bars in the third panel from the top (HET C) indicate the time shift for highly relativistic electrons based on the fitted length of the IMF (675 s); we used the average (1.35 au) of the two determinations given in the electron rows of Table 1.
Current usage metrics show cumulative count of Article Views (full-text article views including HTML views, PDF and ePub downloads, according to the available data) and Abstracts Views on Vision4Press platform.
Data correspond to usage on the plateform after 2015. The current usage metrics is available 48-96 hours after online publication and is updated daily on week days.
Initial download of the metrics may take a while.


