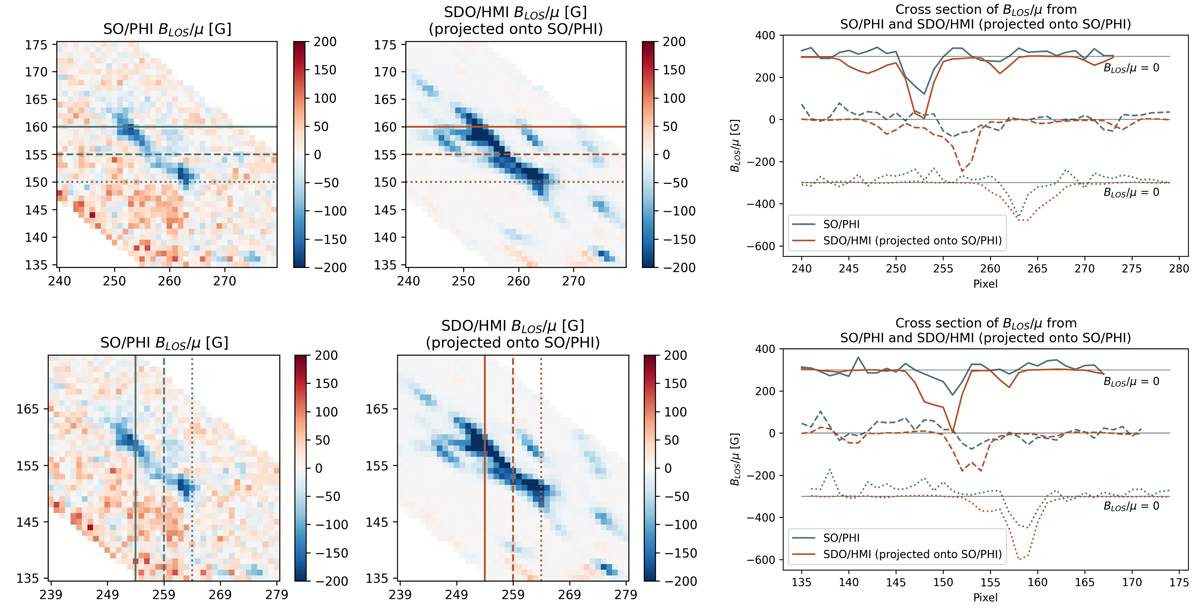
Fig. A.1.
Download original image
Detailed view (left column) of BLOS/μ for a selected area in SO/PHI data at the limb and in SDO/HMI close to disc centre, after re-projection to the limb. The right column shows examples of BLOS/μ along cross-sections marked by the lines in the maps on the left. In the right panels, the different curves are offset by 300 G in ordinate for better visibility (the respective 0 G is marked by the horizontal lines).
Current usage metrics show cumulative count of Article Views (full-text article views including HTML views, PDF and ePub downloads, according to the available data) and Abstracts Views on Vision4Press platform.
Data correspond to usage on the plateform after 2015. The current usage metrics is available 48-96 hours after online publication and is updated daily on week days.
Initial download of the metrics may take a while.