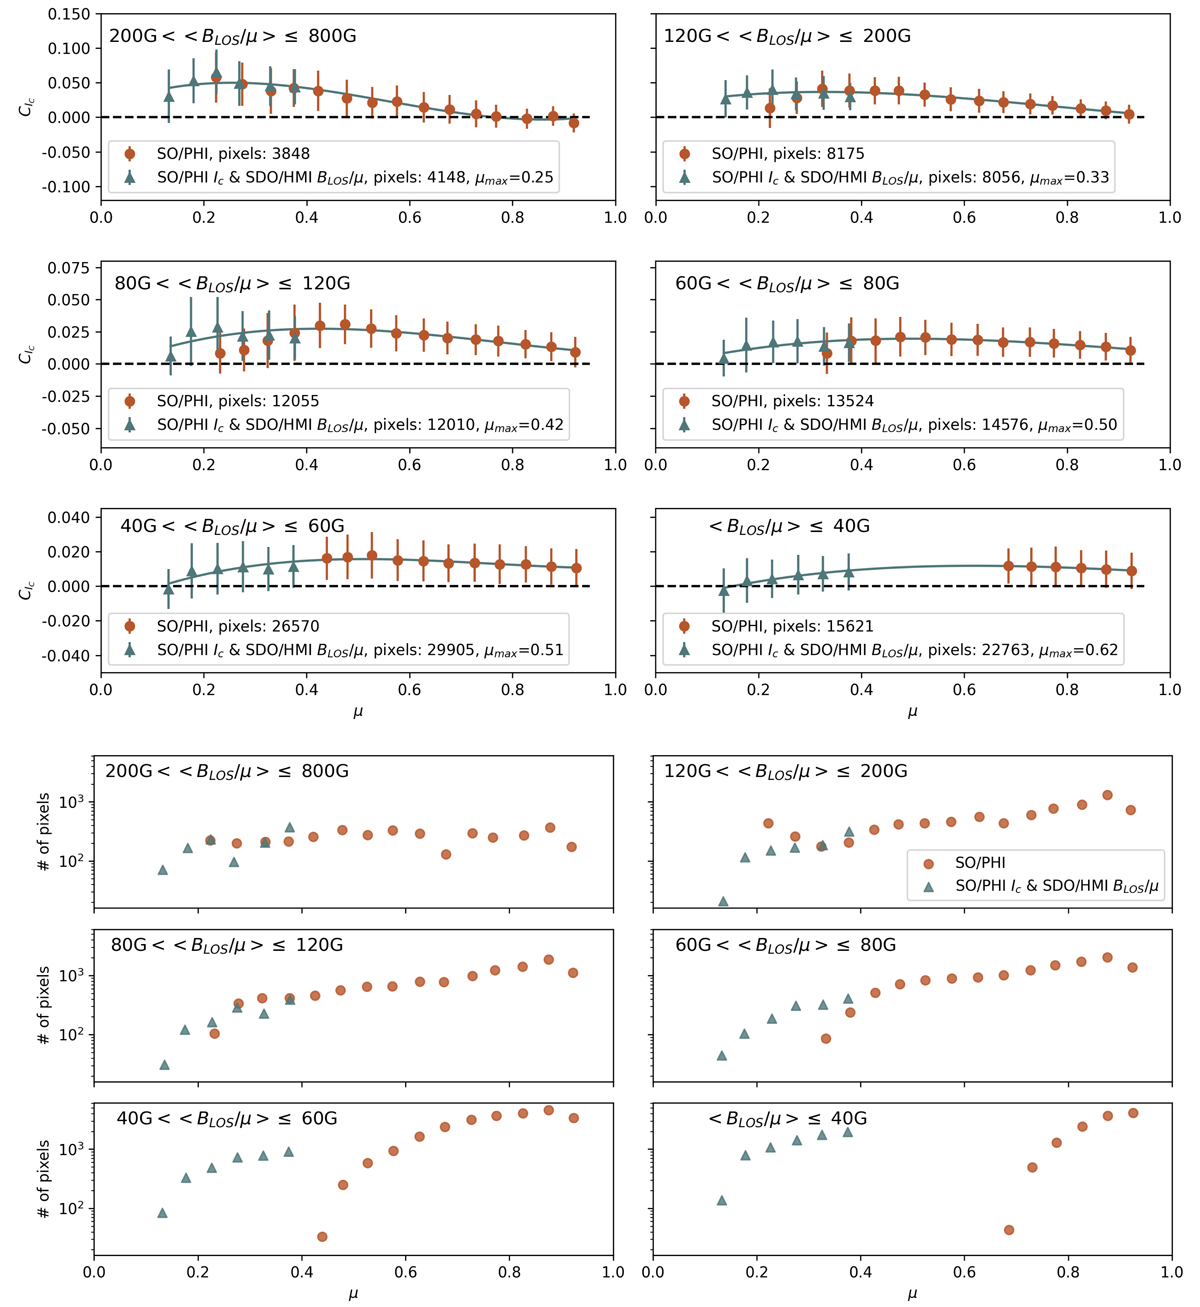
Fig. 5.
Download original image
Same as Fig. 4, but now showing facular contrast vs. μ. The data are displayed in six intervals of BLOS/μ, and in bins of Δμ = 0.05. The third order fit here is done through the combined points, extended with the points derived from SO/PHI only data where μ > 0.4.
Current usage metrics show cumulative count of Article Views (full-text article views including HTML views, PDF and ePub downloads, according to the available data) and Abstracts Views on Vision4Press platform.
Data correspond to usage on the plateform after 2015. The current usage metrics is available 48-96 hours after online publication and is updated daily on week days.
Initial download of the metrics may take a while.