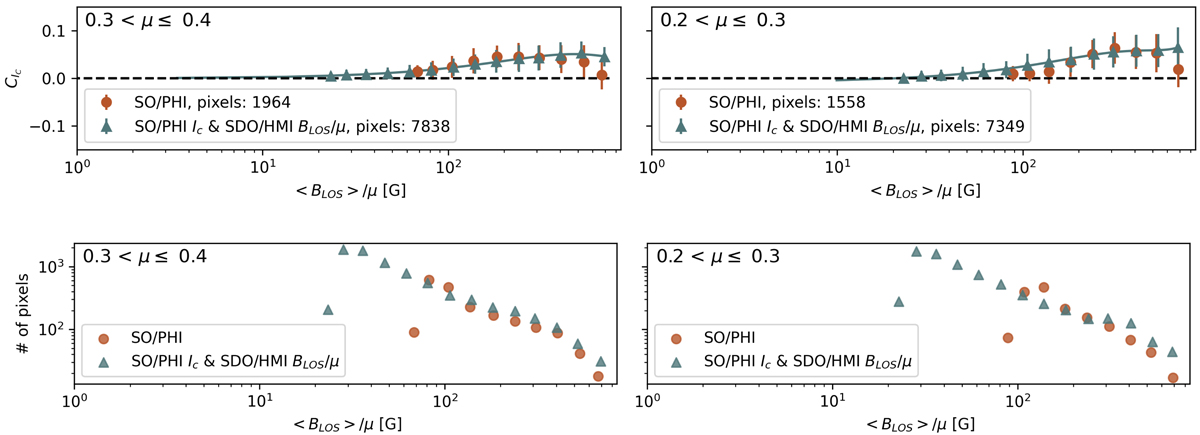
Fig. 4.

Download original image
Facular contrast as a function of BLOS/μ, and the number of pixels in each bin. Top: we computed the contrast curves using the combined SO/PHI and SDO/HMI data as well as the SO/PHI data alone in two μ intervals (0.1 < μ ≤ 0.3, right column, and 0.3 < μ ≤ 0.4, left column). We split the data into equal intervals of log(BLOS/μ). The error bars represent the standard deviation of the pixels within each bin. We fitted a third order curve to the combined data points (continuous green line). Bottom: based on the number of pixels in each bin, we exclude from the plots SO/PHI-based data with μ < 0.2.
Current usage metrics show cumulative count of Article Views (full-text article views including HTML views, PDF and ePub downloads, according to the available data) and Abstracts Views on Vision4Press platform.
Data correspond to usage on the plateform after 2015. The current usage metrics is available 48-96 hours after online publication and is updated daily on week days.
Initial download of the metrics may take a while.


