Fig. 3.
Download original image
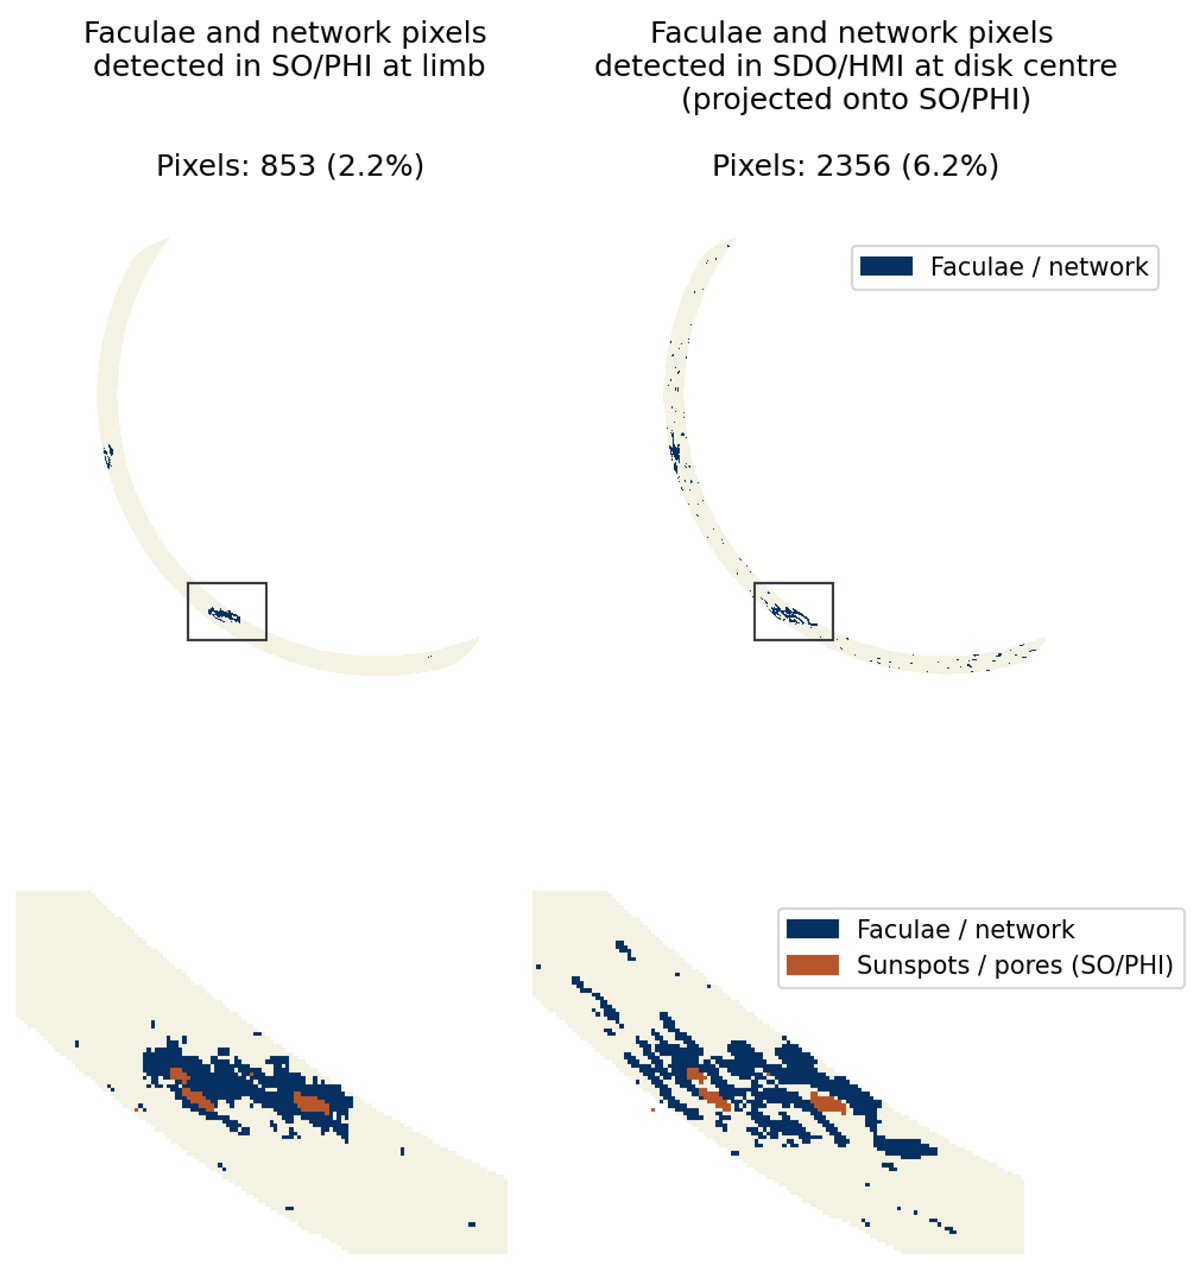
Faculae map identified in SO/PHI (left) and in SDO/HMI, re-projected to the coordinate system of SO/PHI (right). The upper row shows the area analysed in the study, the lower row shows a magnification of the area marked by the black rectangle on the top. In the magnified view, we also show the area that was identified as sunspot in the SO/PHI observations. We indicate the number of pixels identified as faculae in each figure (853 in SO/PHI, and 2356 in SDO/HMI, representing 2.2% and 6.2% of the pixels in this area, respectively). The data shown here are from 6 September 2021.
Current usage metrics show cumulative count of Article Views (full-text article views including HTML views, PDF and ePub downloads, according to the available data) and Abstracts Views on Vision4Press platform.
Data correspond to usage on the plateform after 2015. The current usage metrics is available 48-96 hours after online publication and is updated daily on week days.
Initial download of the metrics may take a while.