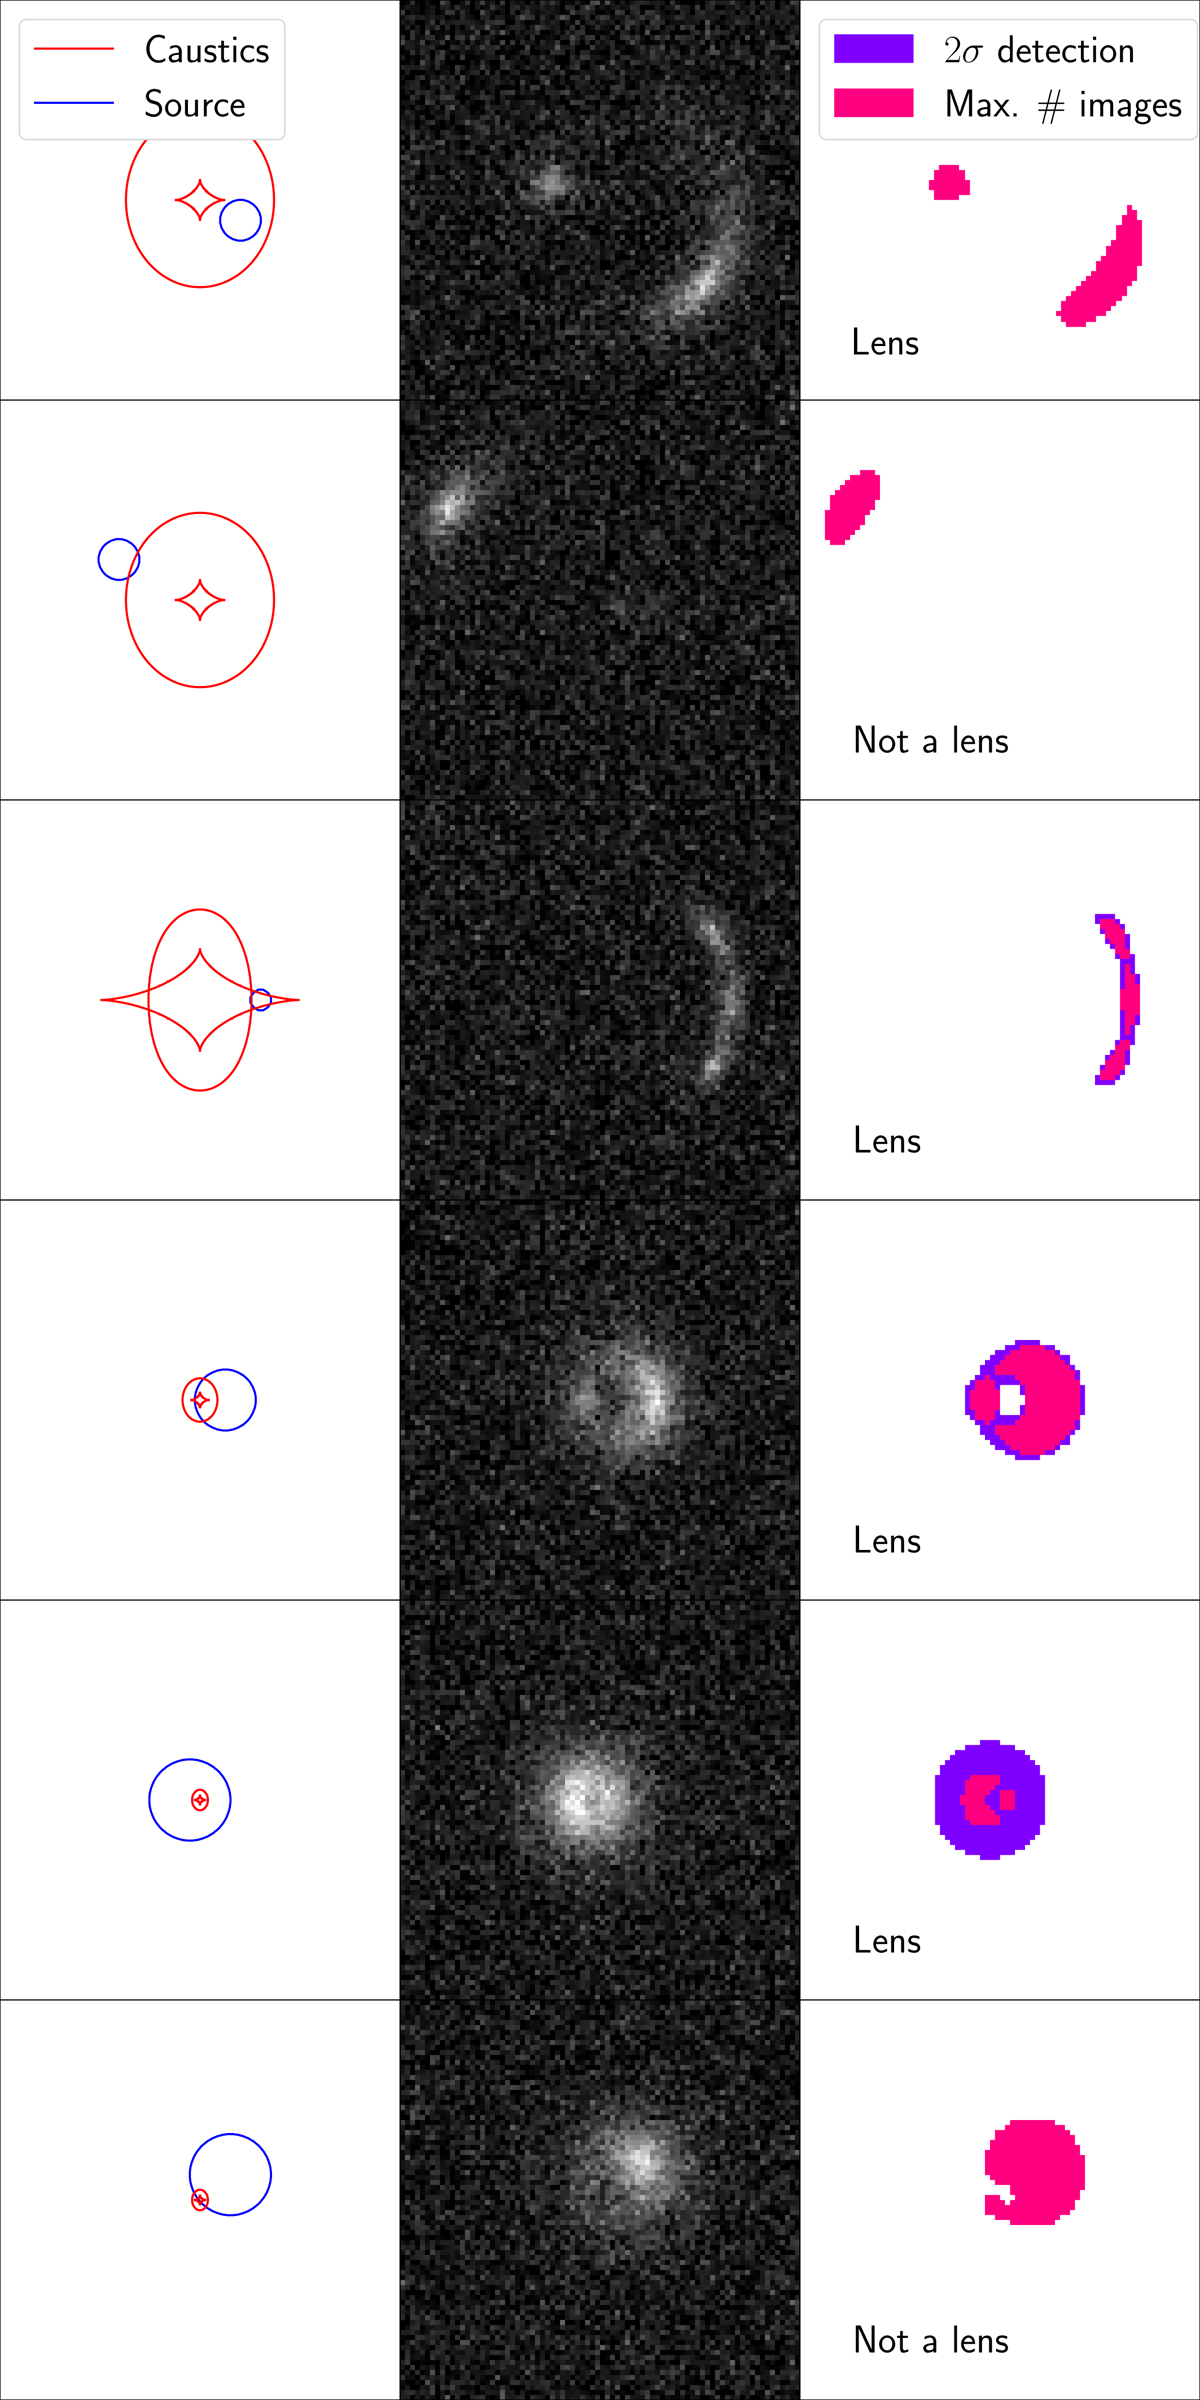
Fig. 3.

Download original image
Criterion used to classify lensed images of extended sources. Six examples are shown. First column: caustics (red curves) and source position (blue circle). The radius of the circle corresponds to the radius at which the surface brightness is equal to 2σ the sky background rms fluctuation for a single pixel. In other words, the blue circle delimits the area of the source that can be detected. Second column: mock image of the lensed source, with added noise. Third column: footprint of the source. The purple footprint is obtained with a 2σ detection criterion. The coral region is the largest footprint with the highest number of detected images.
Current usage metrics show cumulative count of Article Views (full-text article views including HTML views, PDF and ePub downloads, according to the available data) and Abstracts Views on Vision4Press platform.
Data correspond to usage on the plateform after 2015. The current usage metrics is available 48-96 hours after online publication and is updated daily on week days.
Initial download of the metrics may take a while.


