Fig. 18.

Download original image
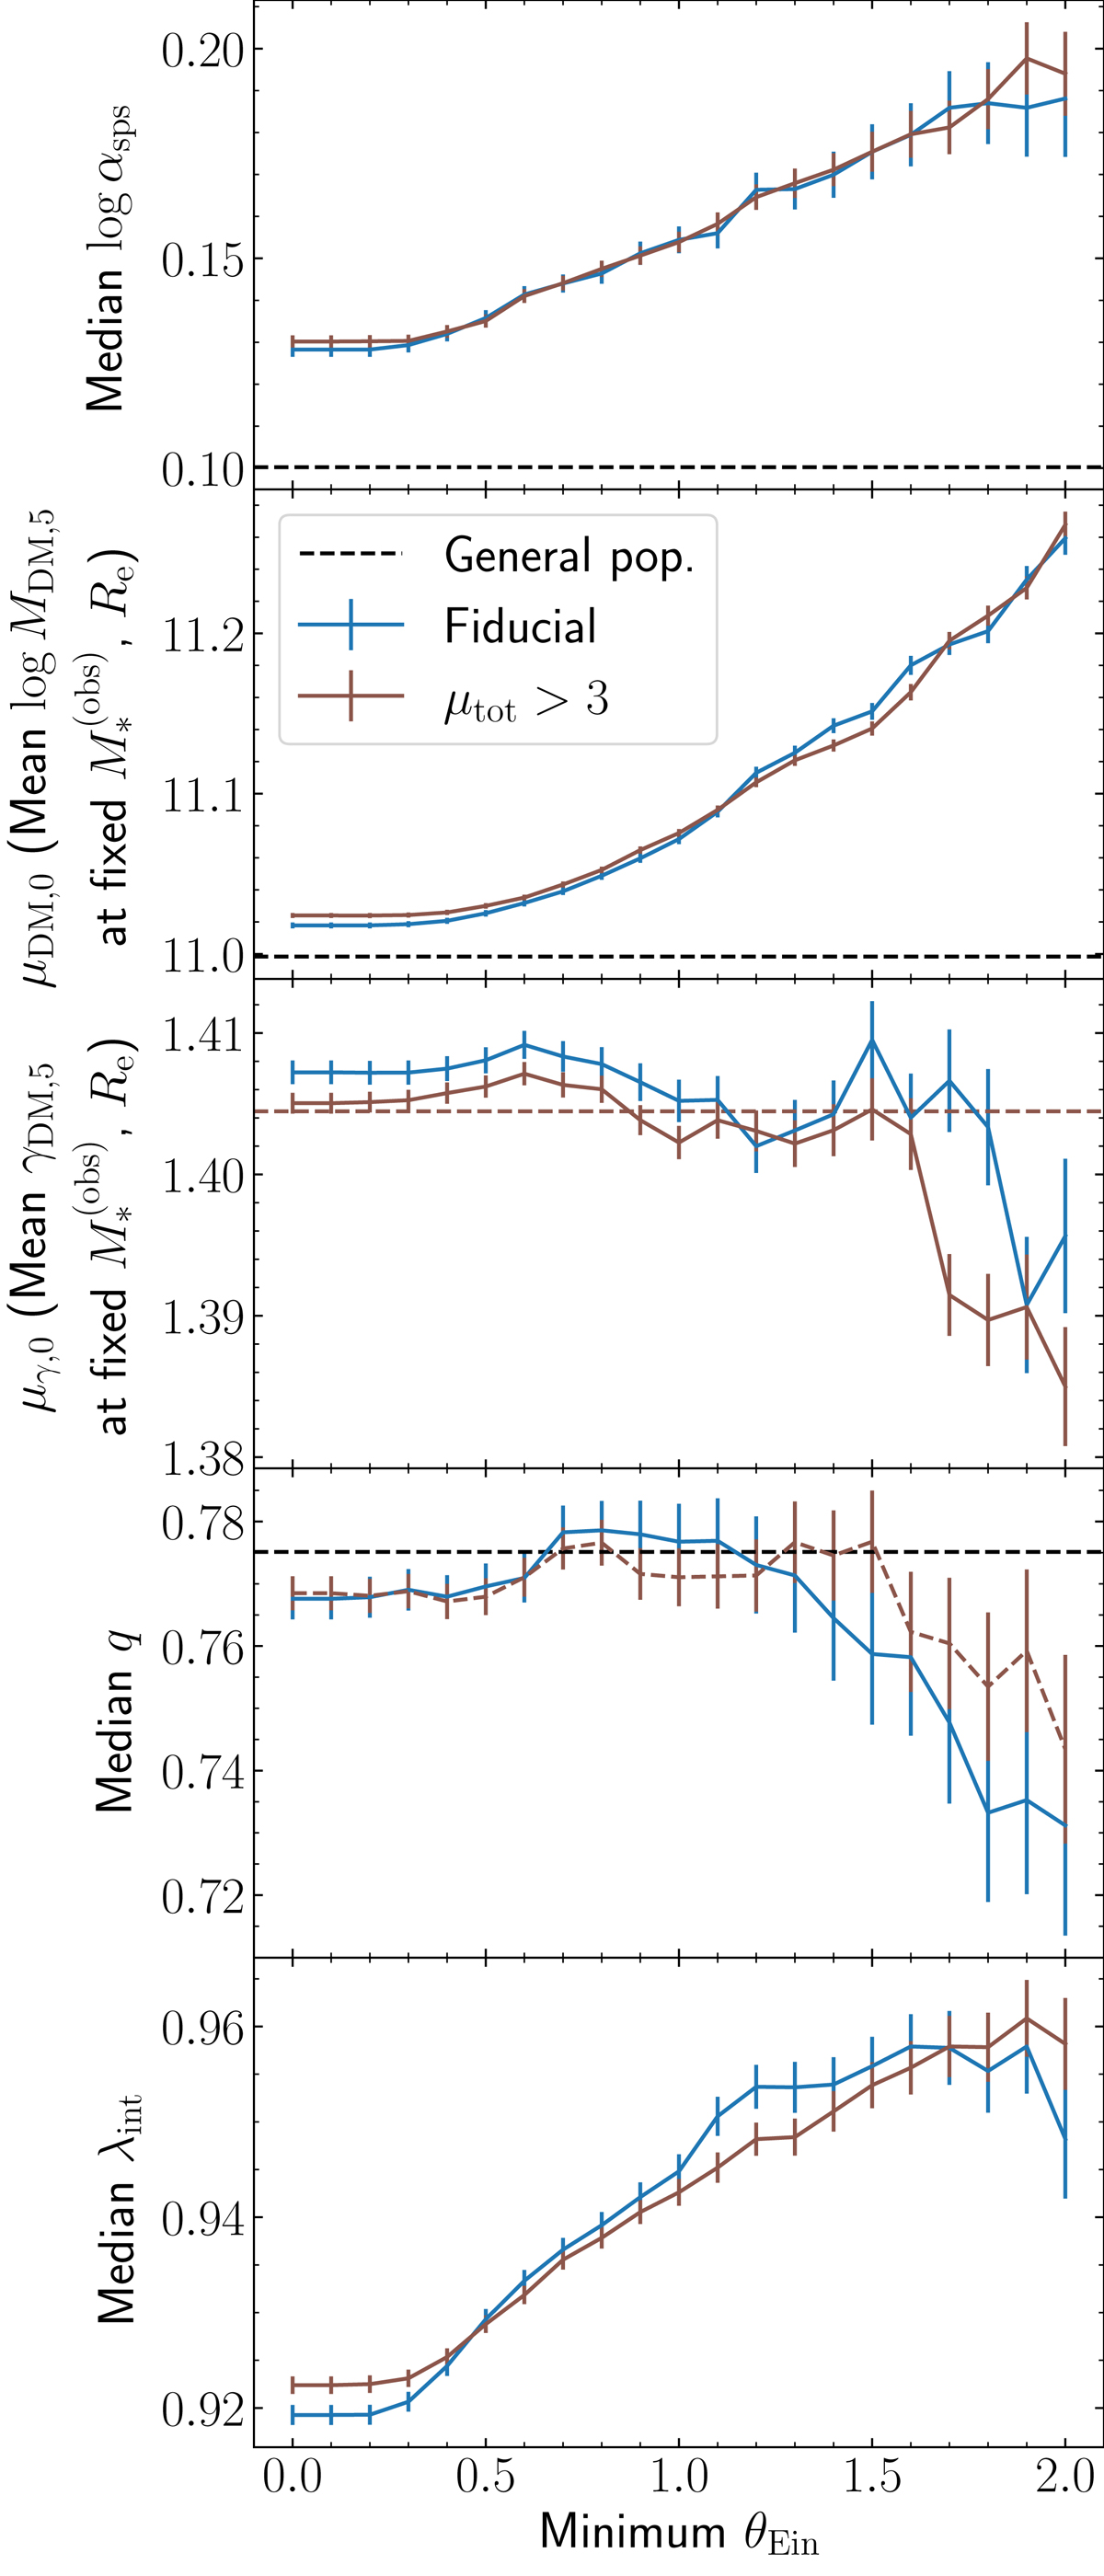
Lens strong lensing bias in the case of a magnification-based lens definition (brown curves), compared to that of the fiducial analysis (blue curves). First panel: median log αsps. Second panel: median MDM, 5 at log M* = 11.5 and log Re = 1.2. Third panel: median γDM at log ![]() = 11.4 and log Re = 1.2. Fourth panel: median axis ratio. Fifth panel: median mass-sheet transformation parameter, defined in Appendix C. In each panel, the dashed line indicates the value of the parent population.
= 11.4 and log Re = 1.2. Fourth panel: median axis ratio. Fifth panel: median mass-sheet transformation parameter, defined in Appendix C. In each panel, the dashed line indicates the value of the parent population.
Current usage metrics show cumulative count of Article Views (full-text article views including HTML views, PDF and ePub downloads, according to the available data) and Abstracts Views on Vision4Press platform.
Data correspond to usage on the plateform after 2015. The current usage metrics is available 48-96 hours after online publication and is updated daily on week days.
Initial download of the metrics may take a while.


