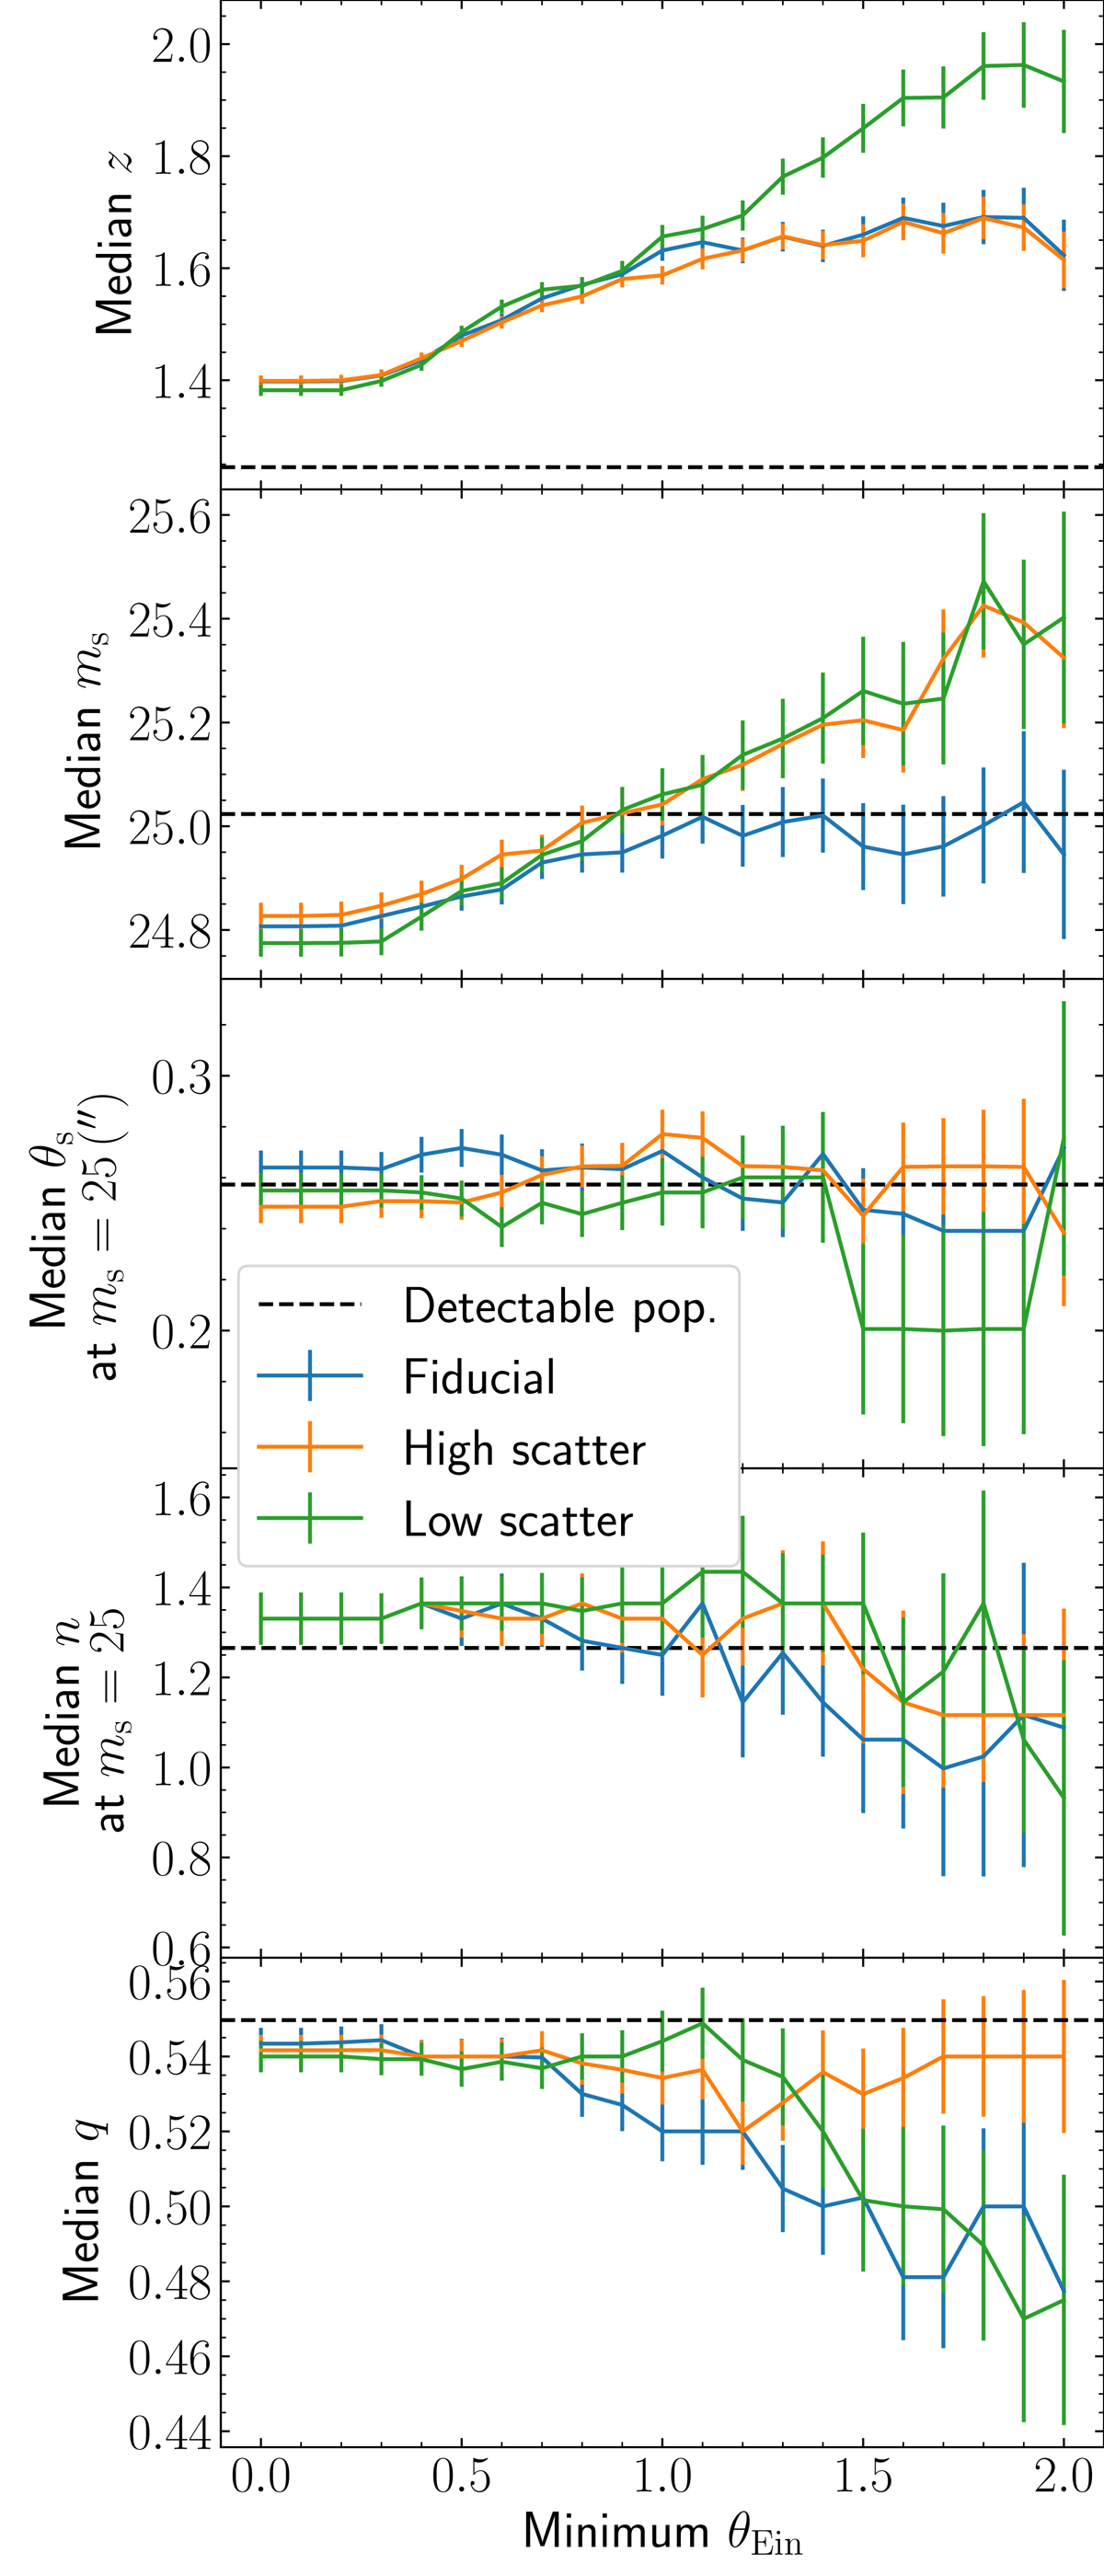
Fig. 16.

Download original image
Bias on source properties as a function of the minimum Einstein radius. First panel: median source redshift. Second panel: median source magnitude. Third panel: median half-light radius in the magnitude bin 24.8 < ms < 25.2. Fourth panel: median Sérsic index in the magnitude bin 24.8 < ms < 25.2. Fifth panel: median axis ratio. In each panel, the dashed line indicates the value of the population of detectable sources. Error bars indicate the standard deviation of the mean of either the full sample (first, second, and fifth panel) or the bin (third and fourth panel).
Current usage metrics show cumulative count of Article Views (full-text article views including HTML views, PDF and ePub downloads, according to the available data) and Abstracts Views on Vision4Press platform.
Data correspond to usage on the plateform after 2015. The current usage metrics is available 48-96 hours after online publication and is updated daily on week days.
Initial download of the metrics may take a while.


