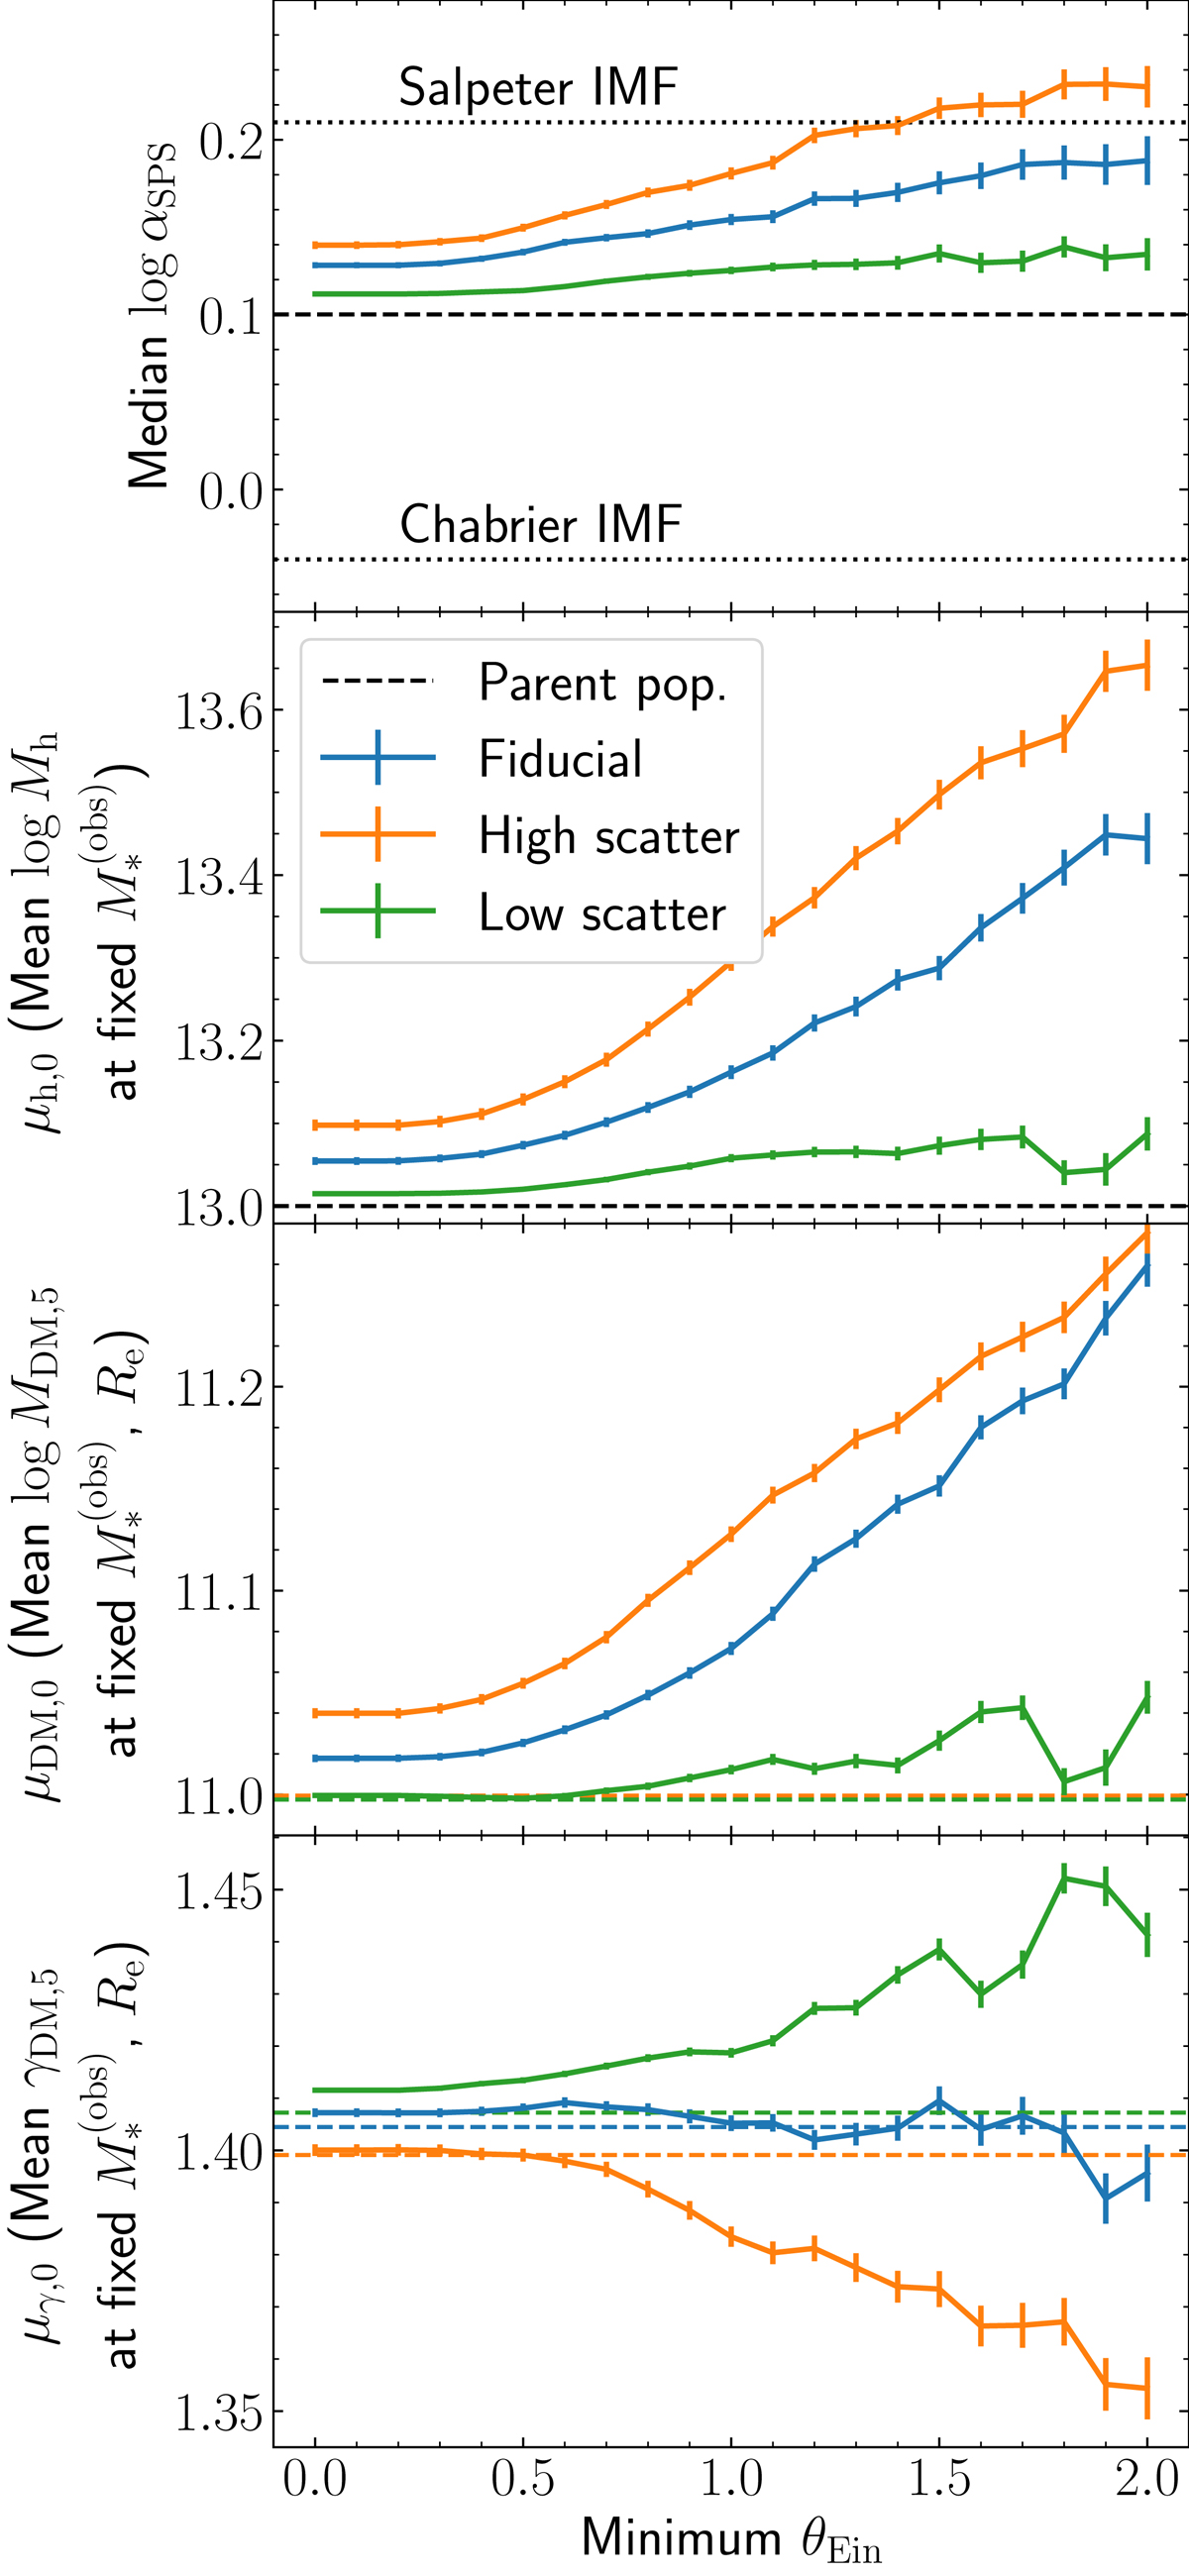
Fig. 15.

Download original image
Bias on lens mass properties as a function of the minimum Einstein radius. First panel: median log αsps. Dotted lines indicate values of αsps corresponding to a Chabrier and a Salpeter IMF (αsps = 1 corresponds to a Kroupa IMF). Second panel: median Mh at log ![]() = 11.4. Third panel: median MDM, 5 at log
= 11.4. Third panel: median MDM, 5 at log ![]() = 11.4 and log Re = 1.2. Fourth panel: median γDM at log
= 11.4 and log Re = 1.2. Fourth panel: median γDM at log ![]() = 11.4 and log Re = 1.2. In each panel, the dashed line indicates the value of the parent population. Error bars indicate the standard deviation of the mean of the lens sample.
= 11.4 and log Re = 1.2. In each panel, the dashed line indicates the value of the parent population. Error bars indicate the standard deviation of the mean of the lens sample.
Current usage metrics show cumulative count of Article Views (full-text article views including HTML views, PDF and ePub downloads, according to the available data) and Abstracts Views on Vision4Press platform.
Data correspond to usage on the plateform after 2015. The current usage metrics is available 48-96 hours after online publication and is updated daily on week days.
Initial download of the metrics may take a while.


