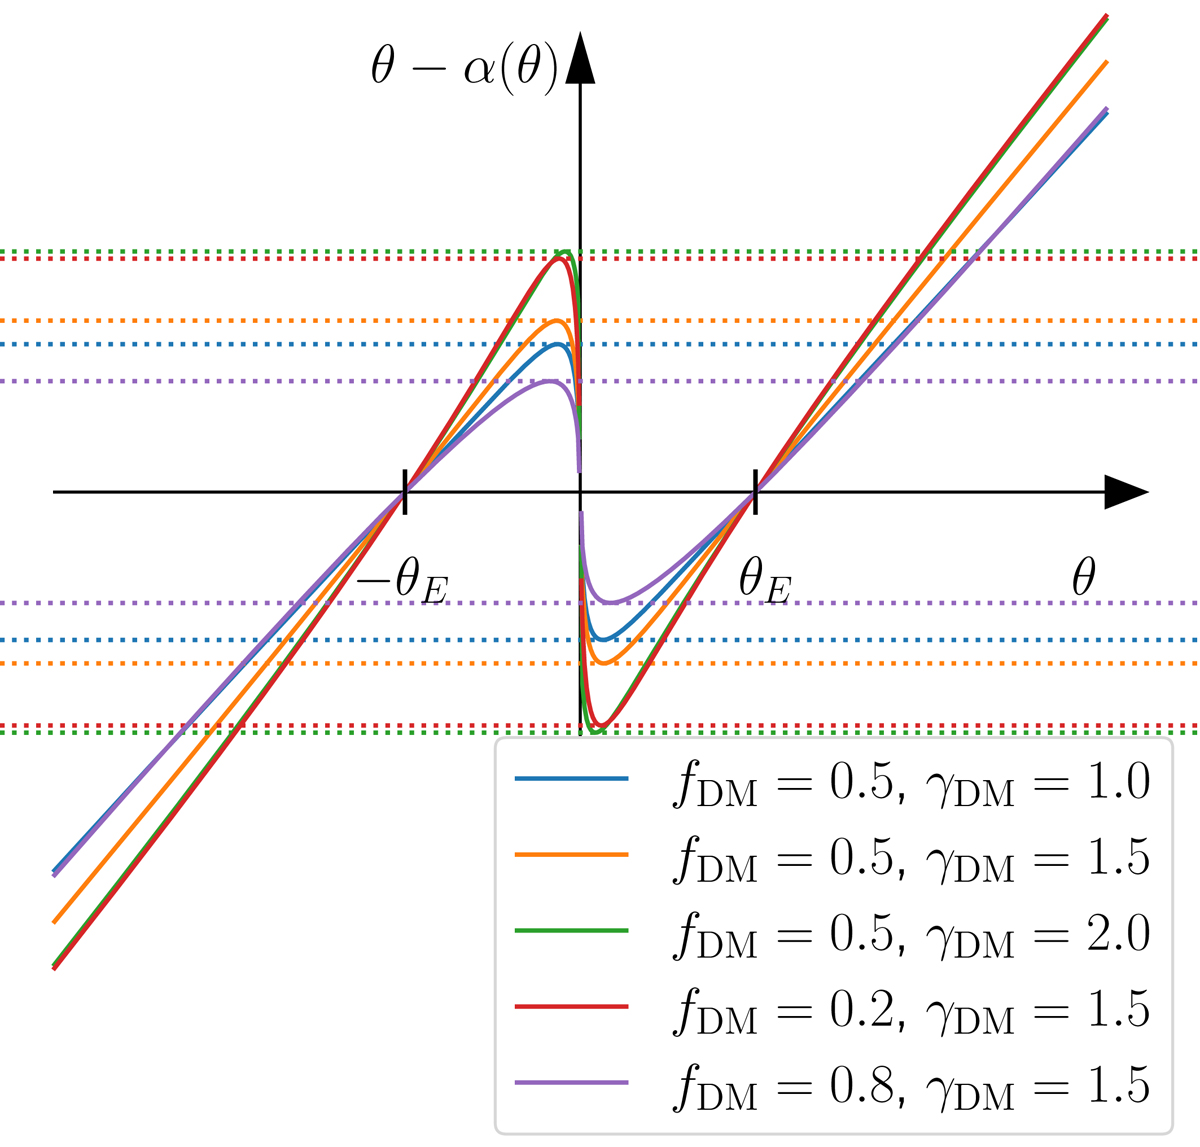
Fig. 1.

Download original image
Lens equation of axisymmetric lenses. Solid lines represent the right-hand side of Eq. (7) for five lenses with different density profiles. Given a source at position β, its lensed images form at the values of θ where the solid line intersects a horizontal line located at β on the vertical axis. Dotted lines represent positions of the radial caustics. Sources located within the radial caustic of a given lens produce three images. The lens models used in this simulation consist of a stellar component and a dark matter halo, as described in Sect. 3.1. Their density profile is plotted in Fig. 4.
Current usage metrics show cumulative count of Article Views (full-text article views including HTML views, PDF and ePub downloads, according to the available data) and Abstracts Views on Vision4Press platform.
Data correspond to usage on the plateform after 2015. The current usage metrics is available 48-96 hours after online publication and is updated daily on week days.
Initial download of the metrics may take a while.


