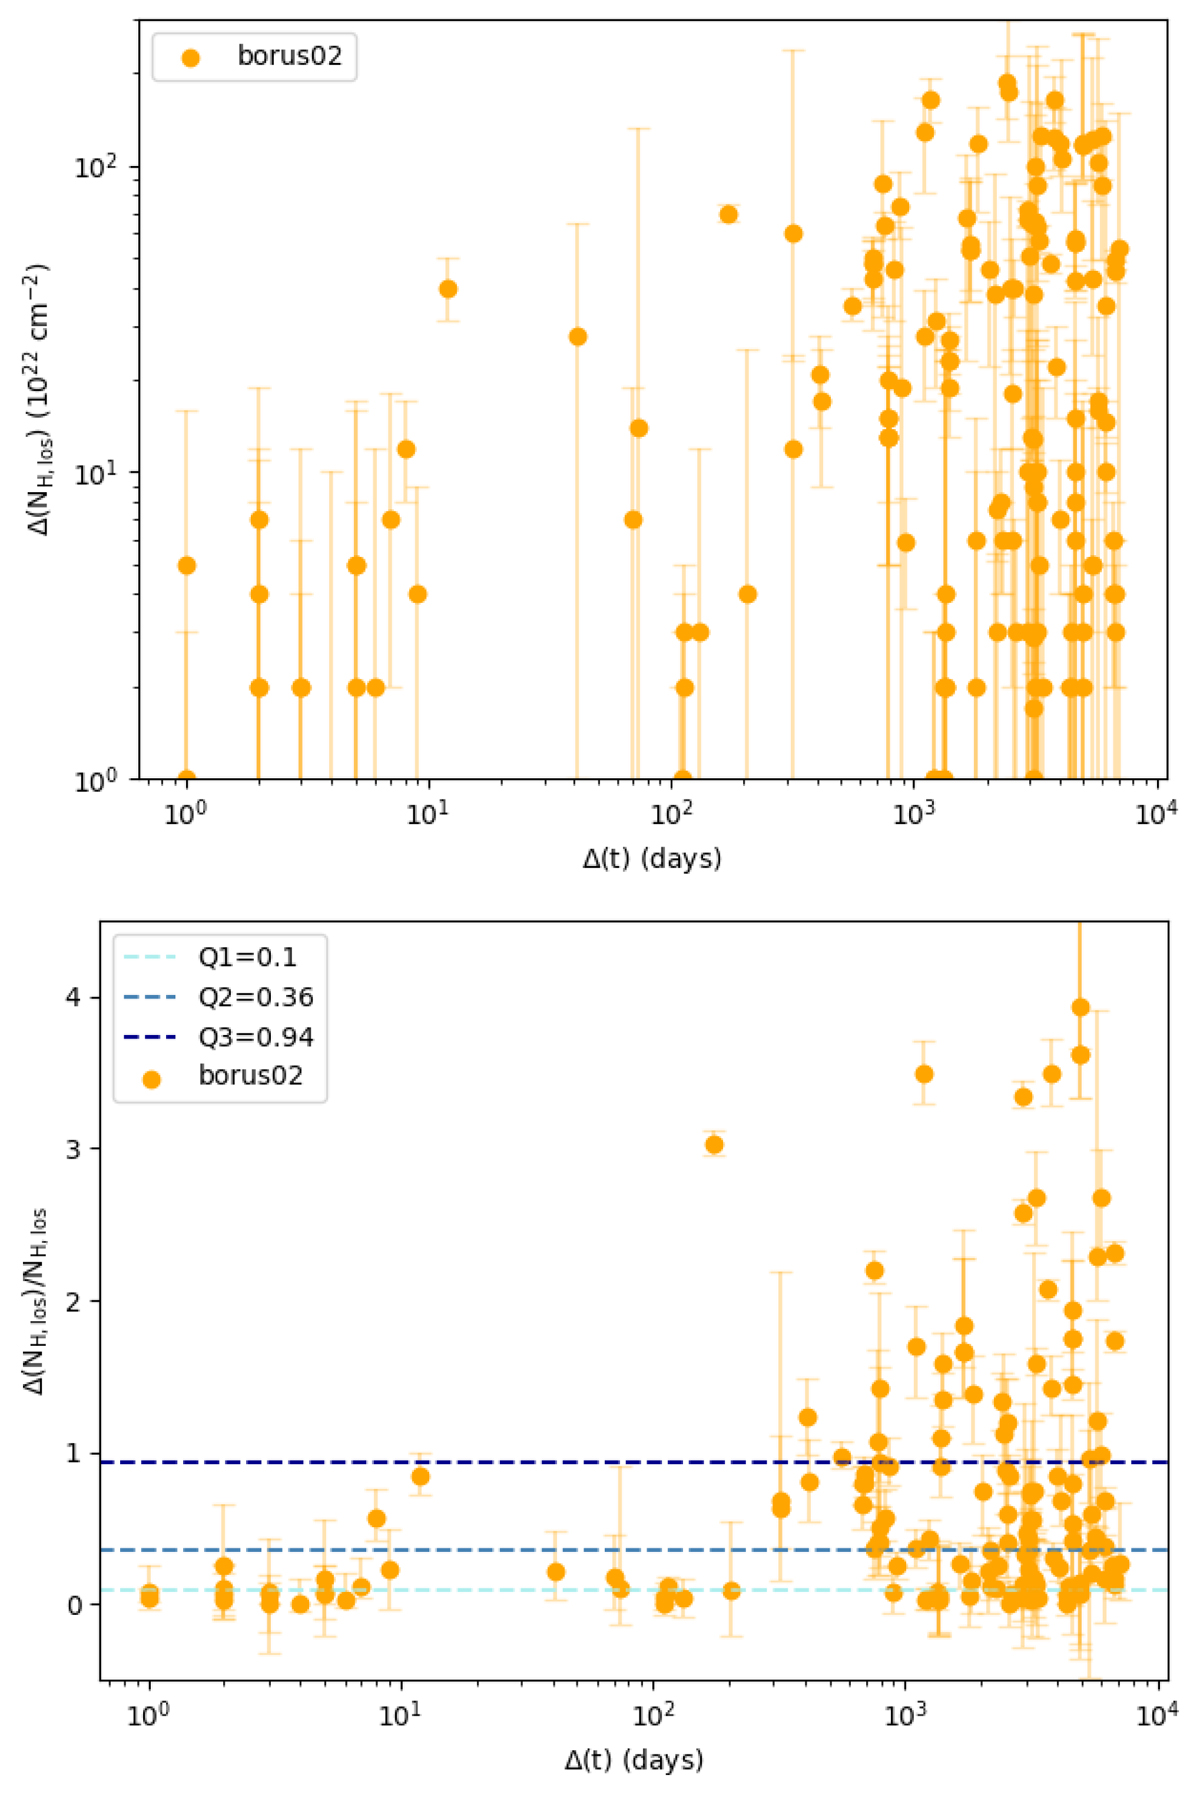
Fig. 5.
Download original image
Δ(NH, los) as a function of Δ(t). Top: borus02-obtained values of Δ(NH, los) between all observation pairs for each source, as a function of the time difference between said observations. Bottom: fractional difference in NH, los between all observation pairs for each single source, with respect to the minimum NH, los of the two, as a function of the time difference between said observations. The 25%, 50% and 75% quartiles of the distribution (Q1, Q2, Q3, respectively) are also shown as dashed horizontal lines.
Current usage metrics show cumulative count of Article Views (full-text article views including HTML views, PDF and ePub downloads, according to the available data) and Abstracts Views on Vision4Press platform.
Data correspond to usage on the plateform after 2015. The current usage metrics is available 48-96 hours after online publication and is updated daily on week days.
Initial download of the metrics may take a while.