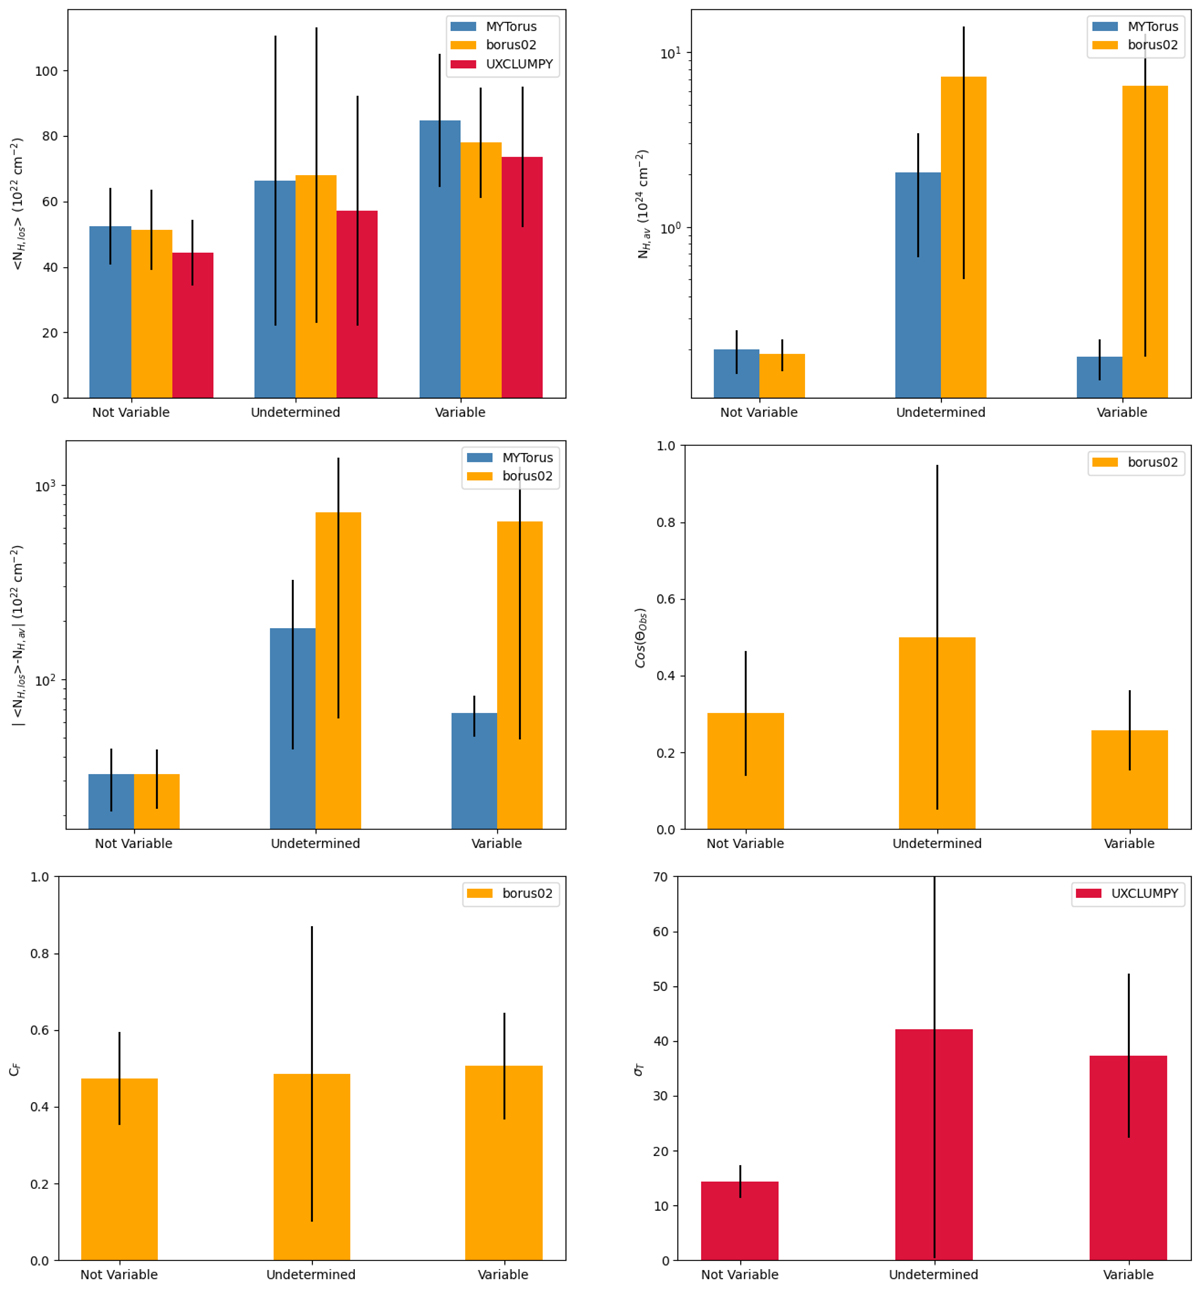
Fig. 4.
Download original image
Histograms containing the averaged best-fit properties of all sources in the sample, grouped by variability class. All models providing the plotted parameter are shown (MYTorus in blue, borus02 in orange, UXCLUMPY in red). Source properties are as follows: Top left, time average of all NH, los (i.e. average value of the obscurer column density) for each single source. Top right,NH, av (i.e. column density of the reflector) considered constant with time. Middle left, absolute value of the difference between the two properties plotted above. Middle right, cosine of the inclination angle, θObs. Bottom left, covering factor of the torus. Bottom right, dispersion of the torus cloud distribution.
Current usage metrics show cumulative count of Article Views (full-text article views including HTML views, PDF and ePub downloads, according to the available data) and Abstracts Views on Vision4Press platform.
Data correspond to usage on the plateform after 2015. The current usage metrics is available 48-96 hours after online publication and is updated daily on week days.
Initial download of the metrics may take a while.