Open Access
Fig. 4
Download original image
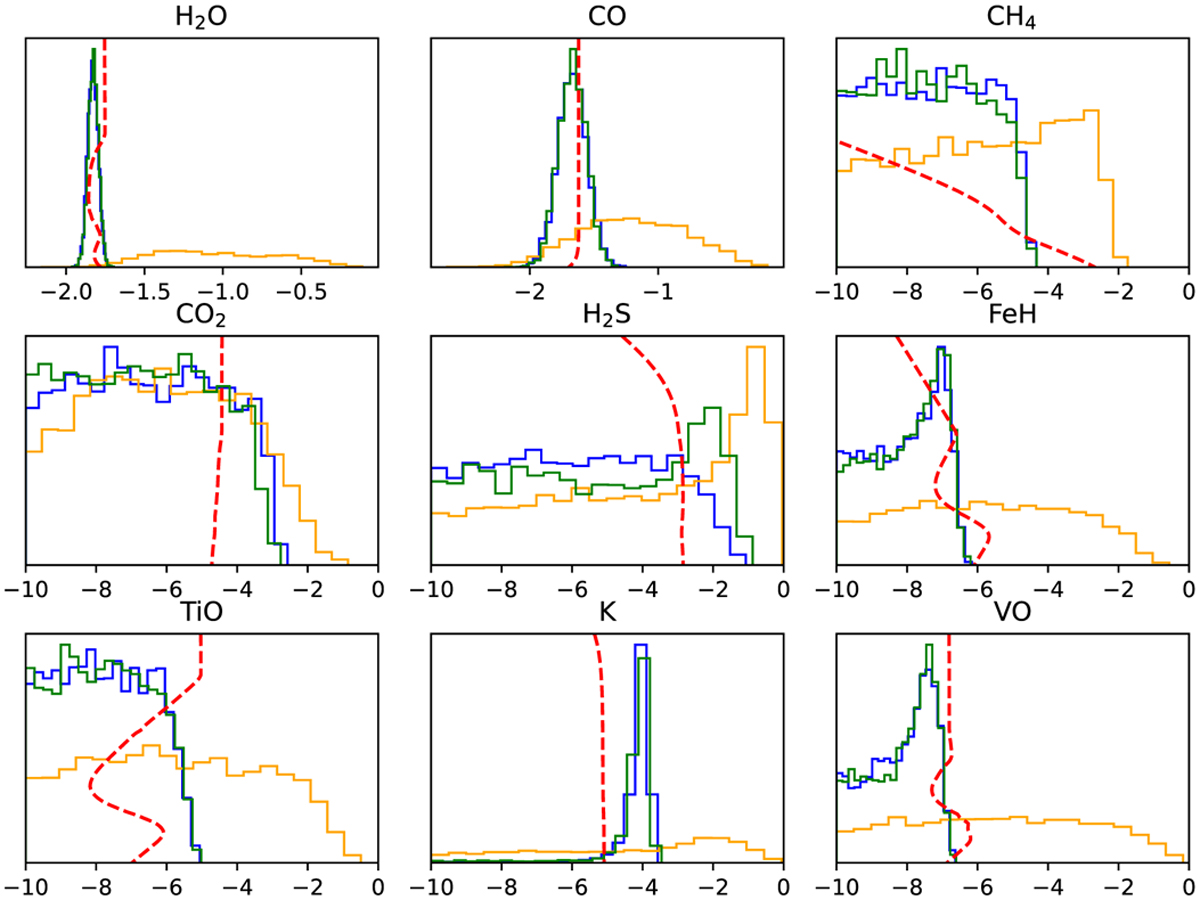
Retrieved posterior distributions of all the molecular abundances included in the three retrievals of the experiment described in 3.4. The solid red lines represent the profile (in log scale) of each molecular abundance along the vertical extent of the atmosphere between 100 bar at the bottom and 10−6 bar at the top.
Current usage metrics show cumulative count of Article Views (full-text article views including HTML views, PDF and ePub downloads, according to the available data) and Abstracts Views on Vision4Press platform.
Data correspond to usage on the plateform after 2015. The current usage metrics is available 48-96 hours after online publication and is updated daily on week days.
Initial download of the metrics may take a while.