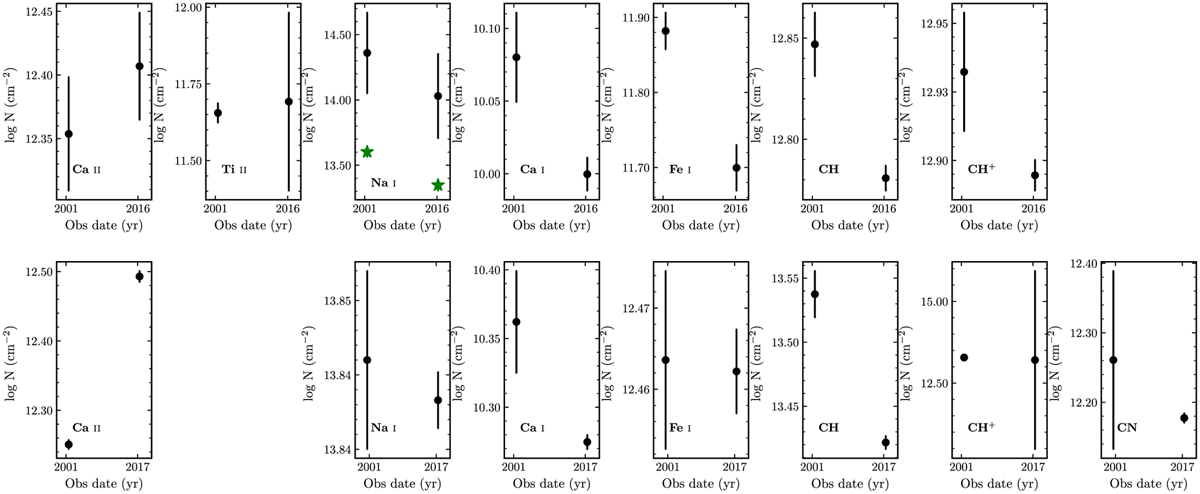
Fig. 5
Download original image
Column densities of various atoms and molecules as measured in the main component (at υ ~ −7.5 km s−1) toward HD 167264 between the oldest available archival spectrum and the EDIBLES data. For Na, the black bar indicates the measurements and uncertainties using the Na I D lines; the green star represents those from the UV lines at 3300 Å. The lower panel shows similar measurements for HD 147933. We note that we used the Na I UV lines rather than the saturated Na I D lines.
Current usage metrics show cumulative count of Article Views (full-text article views including HTML views, PDF and ePub downloads, according to the available data) and Abstracts Views on Vision4Press platform.
Data correspond to usage on the plateform after 2015. The current usage metrics is available 48-96 hours after online publication and is updated daily on week days.
Initial download of the metrics may take a while.