Fig. 4
Download original image
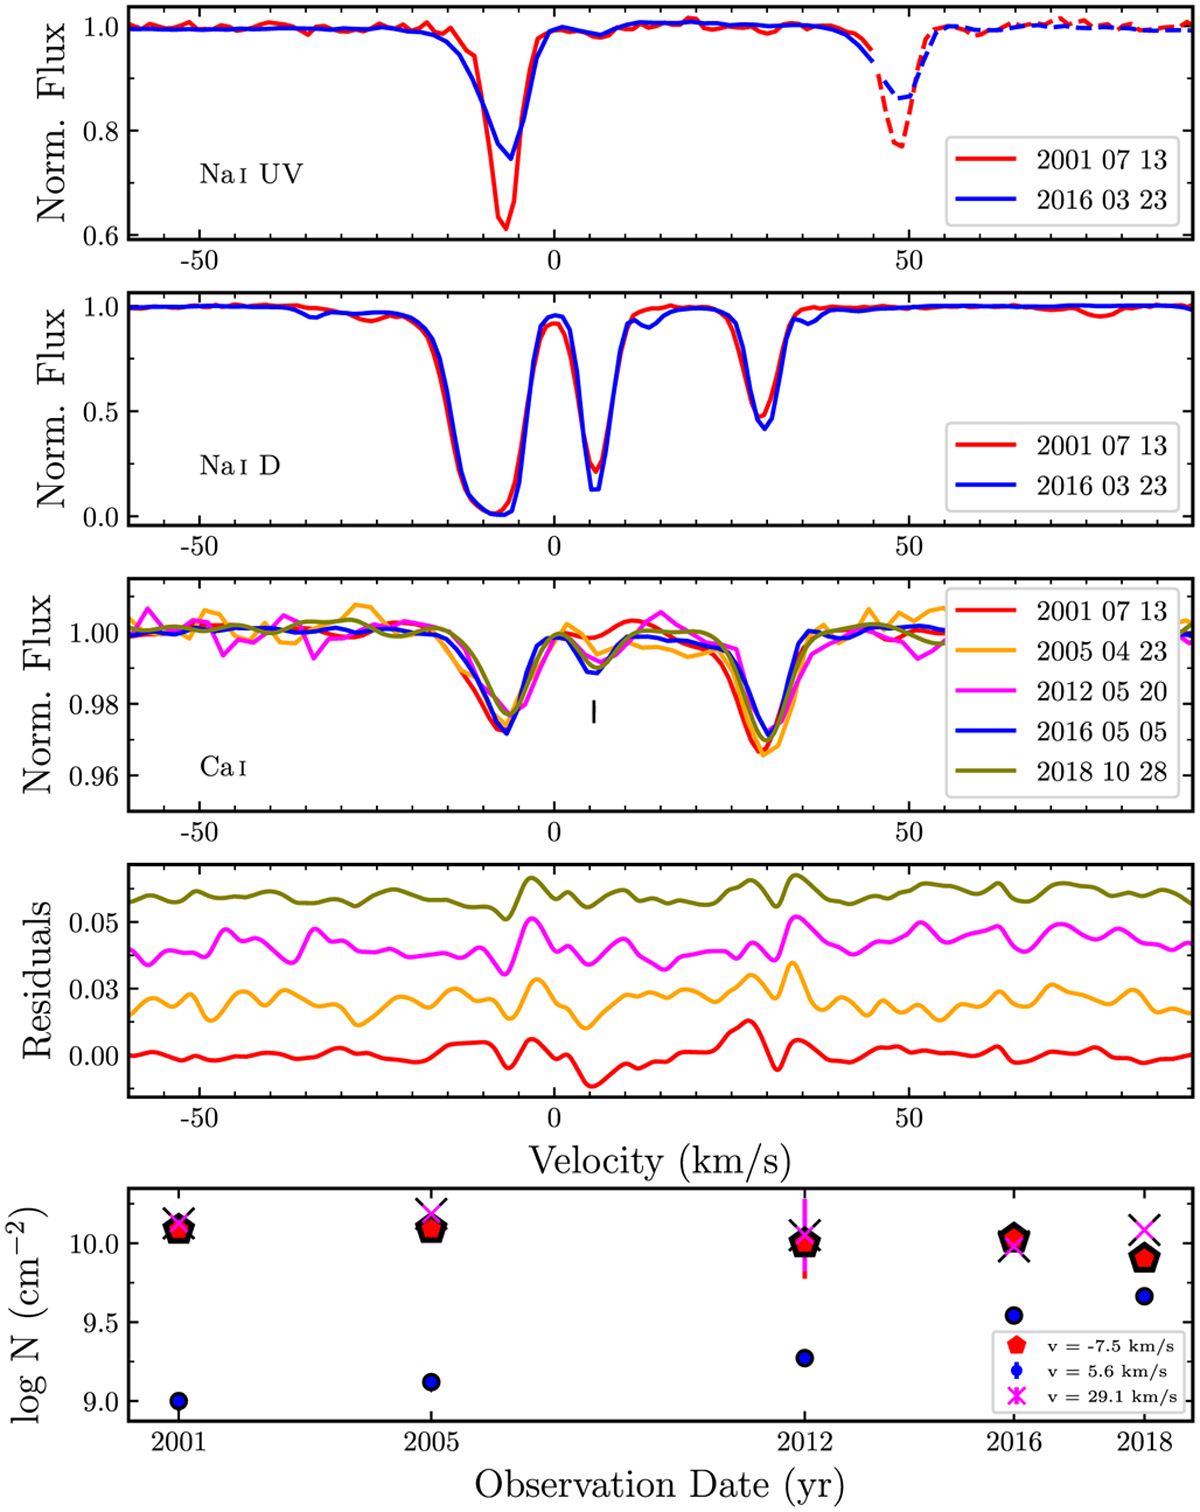
Archival and the EDIBLES spectra in the wavelength range of the Na I lines (top two panels) and the Ca I line (third panel) toward HD 167264. The fourth panel shows the residuals of the archival spectra after subtracting the 2016 EDIBLES spectrum in the range of the Ca I lines. The bottom panel shows the corresponding column densities for the three different Ca I components over time. Note the very clear increase in column density for the central component (at υ = 5.6 km s−1) corresponding to the feature indicated by the arrow in the Ca I plot. The main component (at υ = −7.5 km s−1) may show a small but systematic decrease in the column density over the same time period; no systematic changes are seen for the third component (at υ = 29.1 km s−1). We note that the apparent component at υ ≈ 49 km s−1 in the Na I UV line is in fact the second line in the doublet and thus not a real component.
Current usage metrics show cumulative count of Article Views (full-text article views including HTML views, PDF and ePub downloads, according to the available data) and Abstracts Views on Vision4Press platform.
Data correspond to usage on the plateform after 2015. The current usage metrics is available 48-96 hours after online publication and is updated daily on week days.
Initial download of the metrics may take a while.